Sampling and Random
Sampling and Random
简单随机抽样
df.sample()
1786年,皮埃尔-西蒙-拉普拉斯意识到你可以用较少的精力来估计人口。他没有询问每一个住户,而是询问了一小部分住户,并利用统计学来估计整个人口的数量。这种对整个人口的一个子集进行研究的技术被称为抽样。通过抽样,由样本特征可预测总体特征。
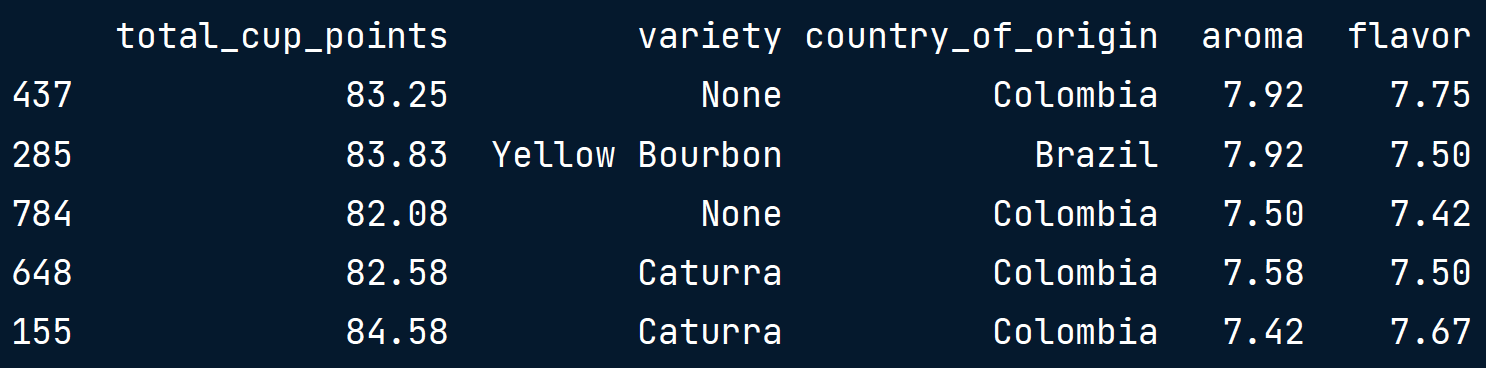
pts_vs_flavor_samp = pts_vs_flavor_pop.sample(n=10)
			total_cup_points 	flavor
1088 	80.33 						7.17
......
1027 	80.92 						7.25
62 		85.58 						8.17

[10 rows x 2 columns]
设置种子
coffee_ratings.sample(n=5, random_state=19000113)
抽样偏差
::: detail 查看一关于美国大选的民意调查
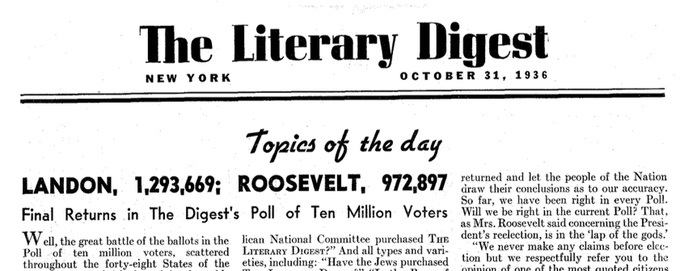
1936年,一家名为《文学文摘》的报纸进行了一次广泛的民意调查,试图预测下一届美国总统选举。他们给1000万选民打了电话,得到了200多万份答复。大约有一百三十万人说他们会投票给兰登,只有不到一百万人说他们会投票给罗斯福。也就是说,兰登被预测将获得百分之五十七的选票,而罗斯福被预测将获得百分之四十三的选票。由于样本量如此之大,人们推测这项民调会非常准确。然而,在选举中,罗斯福以压倒性优势赢得了百分之六十二的选票。那么,什么地方出了问题?好吧,在1936年,电话是一种奢侈品,所以《文学文摘》所联系的人都是比较有钱的。选民的样本并不能代表整个选民群体,因此民调出现了样本偏差。数据是通过最简单的方法收集的,在这种情况下就是打电话给人们。这被称为便利抽样,往往容易出现样本偏差。在取样之前,我们需要思考我们的数据收集过程,以避免有偏见的结果。
- 预测:Landon 获得 57%;罗斯福获得 43%
- 实际结果:Landon 获得 38%;罗斯福 62%
:::
- 样本不代表总体,导致样本偏差
- 用最简单的方法收集数据称为便利抽样
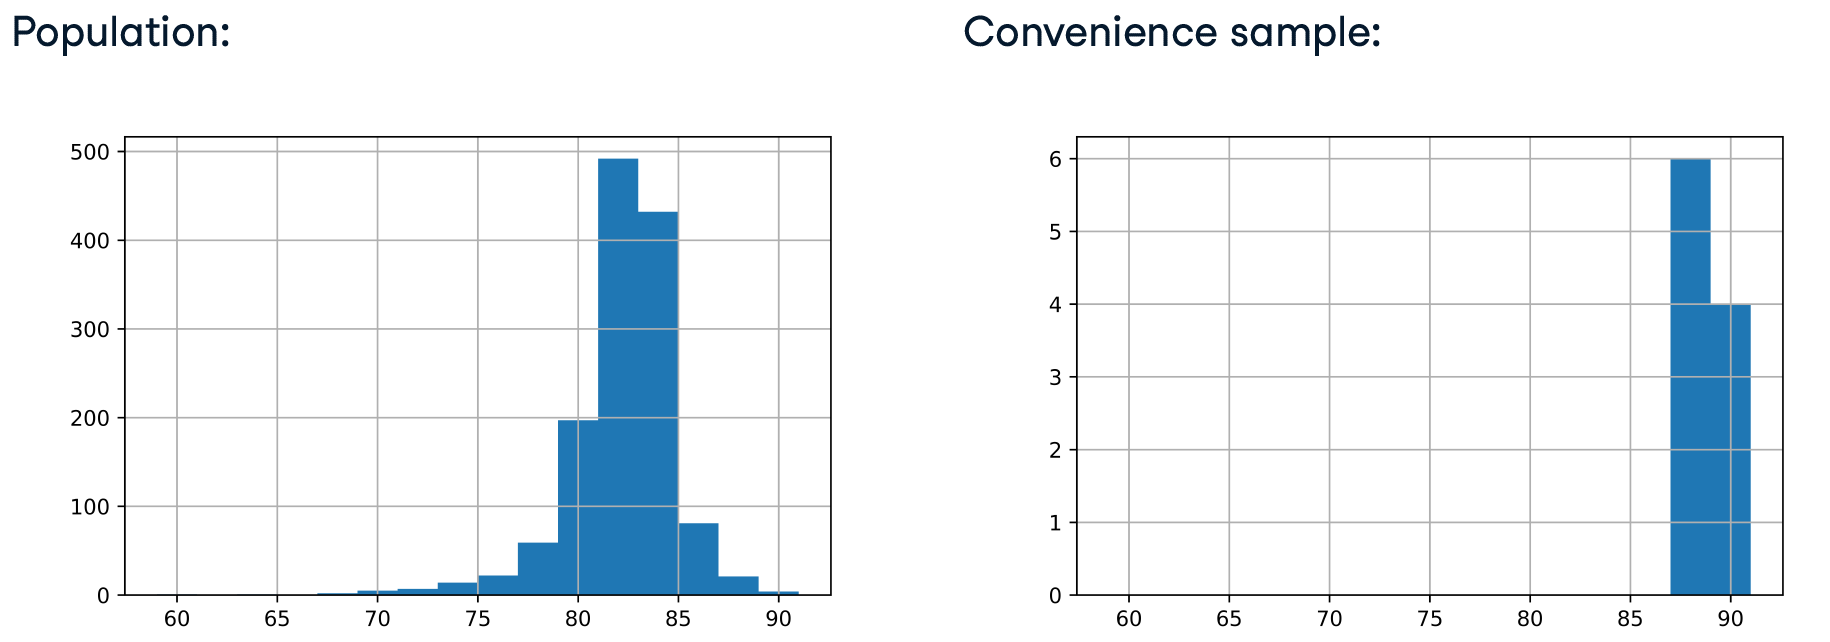
直方图是可视化选择偏差的一个好方法。注意到在使用随机抽样时,分布的形状是如何更紧密地结合在一起的。
import matplotlib.pyplot as plt
import numpy as np
coffee_ratings["total_cup_points"].hist(bins=np.arange(59, 93, 2))
plt.show()

coffee_ratings_first10["total_cup_points"].hist(bins=np.arange(59, 93, 2))
plt.show()
生成随机数
np.random.xxx()
由计算机生成的随机数通常为伪随机数。
- 伪随机数生成既便宜又快速
- 从前一个“随机”数计算的下一个“随机”数
- 从种子计算的第一个“随机”数
- 相同的种子值产生相同的随机数
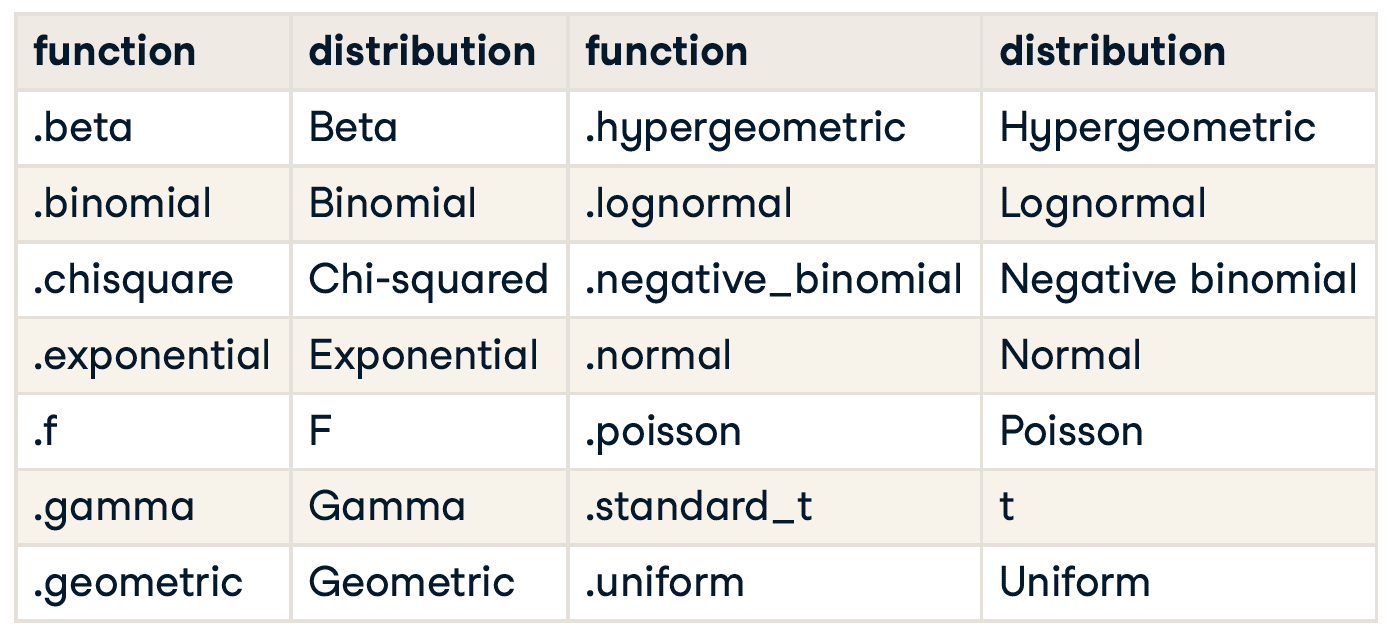
随机数生成函数
Prepend with numpy.random , such as numpy.random.beta()
- numpy.random.random() 生成随机数
- np.random.uniform(low = 0, high = 5, size = 5000)
np.random.seed(20000229)
# 以 mean = 2, std = 1.5 随机取样
np.random.normal(loc=2, scale=1.5, size=2)
array([-0.59030264, 1.87821258])
Python Random
使用python 原生 random 对 原生list随机抽样。
# Create a list of unique JobRole values
job_roles_pop = list(attrition_pop["JobRole"].unique())

# Randomly sample four JobRole values
job_roles_samp = random.sample(job_roles_pop, k = 4)

# Print the result
print(job_roles_samp)
['Research_Director', 'Research_Scientist', 'Human_Resources', 'Manager']
系统抽样
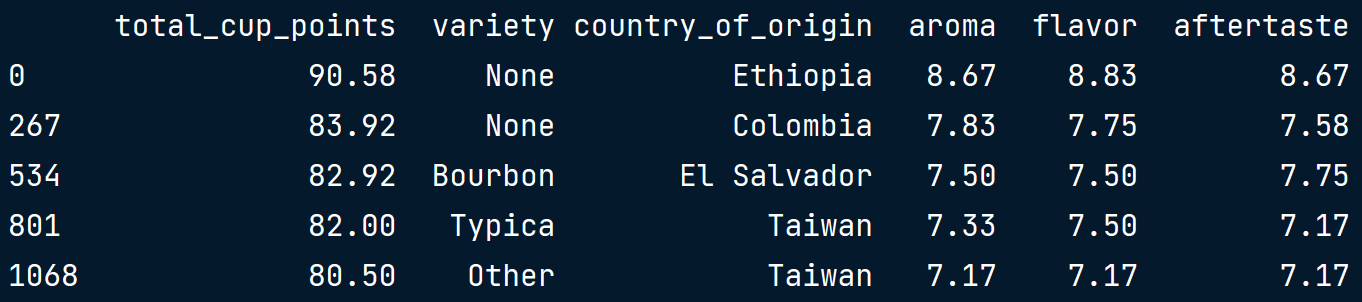
在我们的咖啡评级数据集中,人口由咖啡品种组成,而不是抽奖券或彩票球。为了执行简单的随机抽样,我们随机抽取一些,一次一个。每种咖啡都有与其他咖啡相同的机会被采摘。使用这种技术时,有时我们可能会得到两个在数据集中彼此相邻的咖啡,有时我们可能会得到数据集中的大片区域根本没有选择。另一种抽样方法被称为系统抽样。这种方法以固定的时间间隔对人口进行抽样。在这里,从上到下,从左到右的每一行中,每五杯咖啡都被抽样。
Systematic sampling

系统抽样过程
sample_size = 5
pop_size = len(coffee_ratings)
interval = pop_size // sample_size
coffee_ratings.iloc[::interval]
系统抽样的问题
但是,系统抽样存在问题。假设我们对咖啡的余味属性的统计感兴趣。为了检查这一点,首先,我们使用 reset_index 在我们可以绘制的数据框中创建一列索引值。根据索引绘制余味显示了一种模式。前面的行通常比后面的行具有更高的回味分数。这会在我们计算的统计数据中引入偏差。一般来说,只有当这样的图没有模式时,使用系统抽样才是安全的;也就是说,它只是看起来像噪音。
coffee_ratings_with_id = coffee_ratings.reset_index()
coffee_ratings_with_id.plot(x="index", y="aftertaste", kind="scatter")
plt.show()
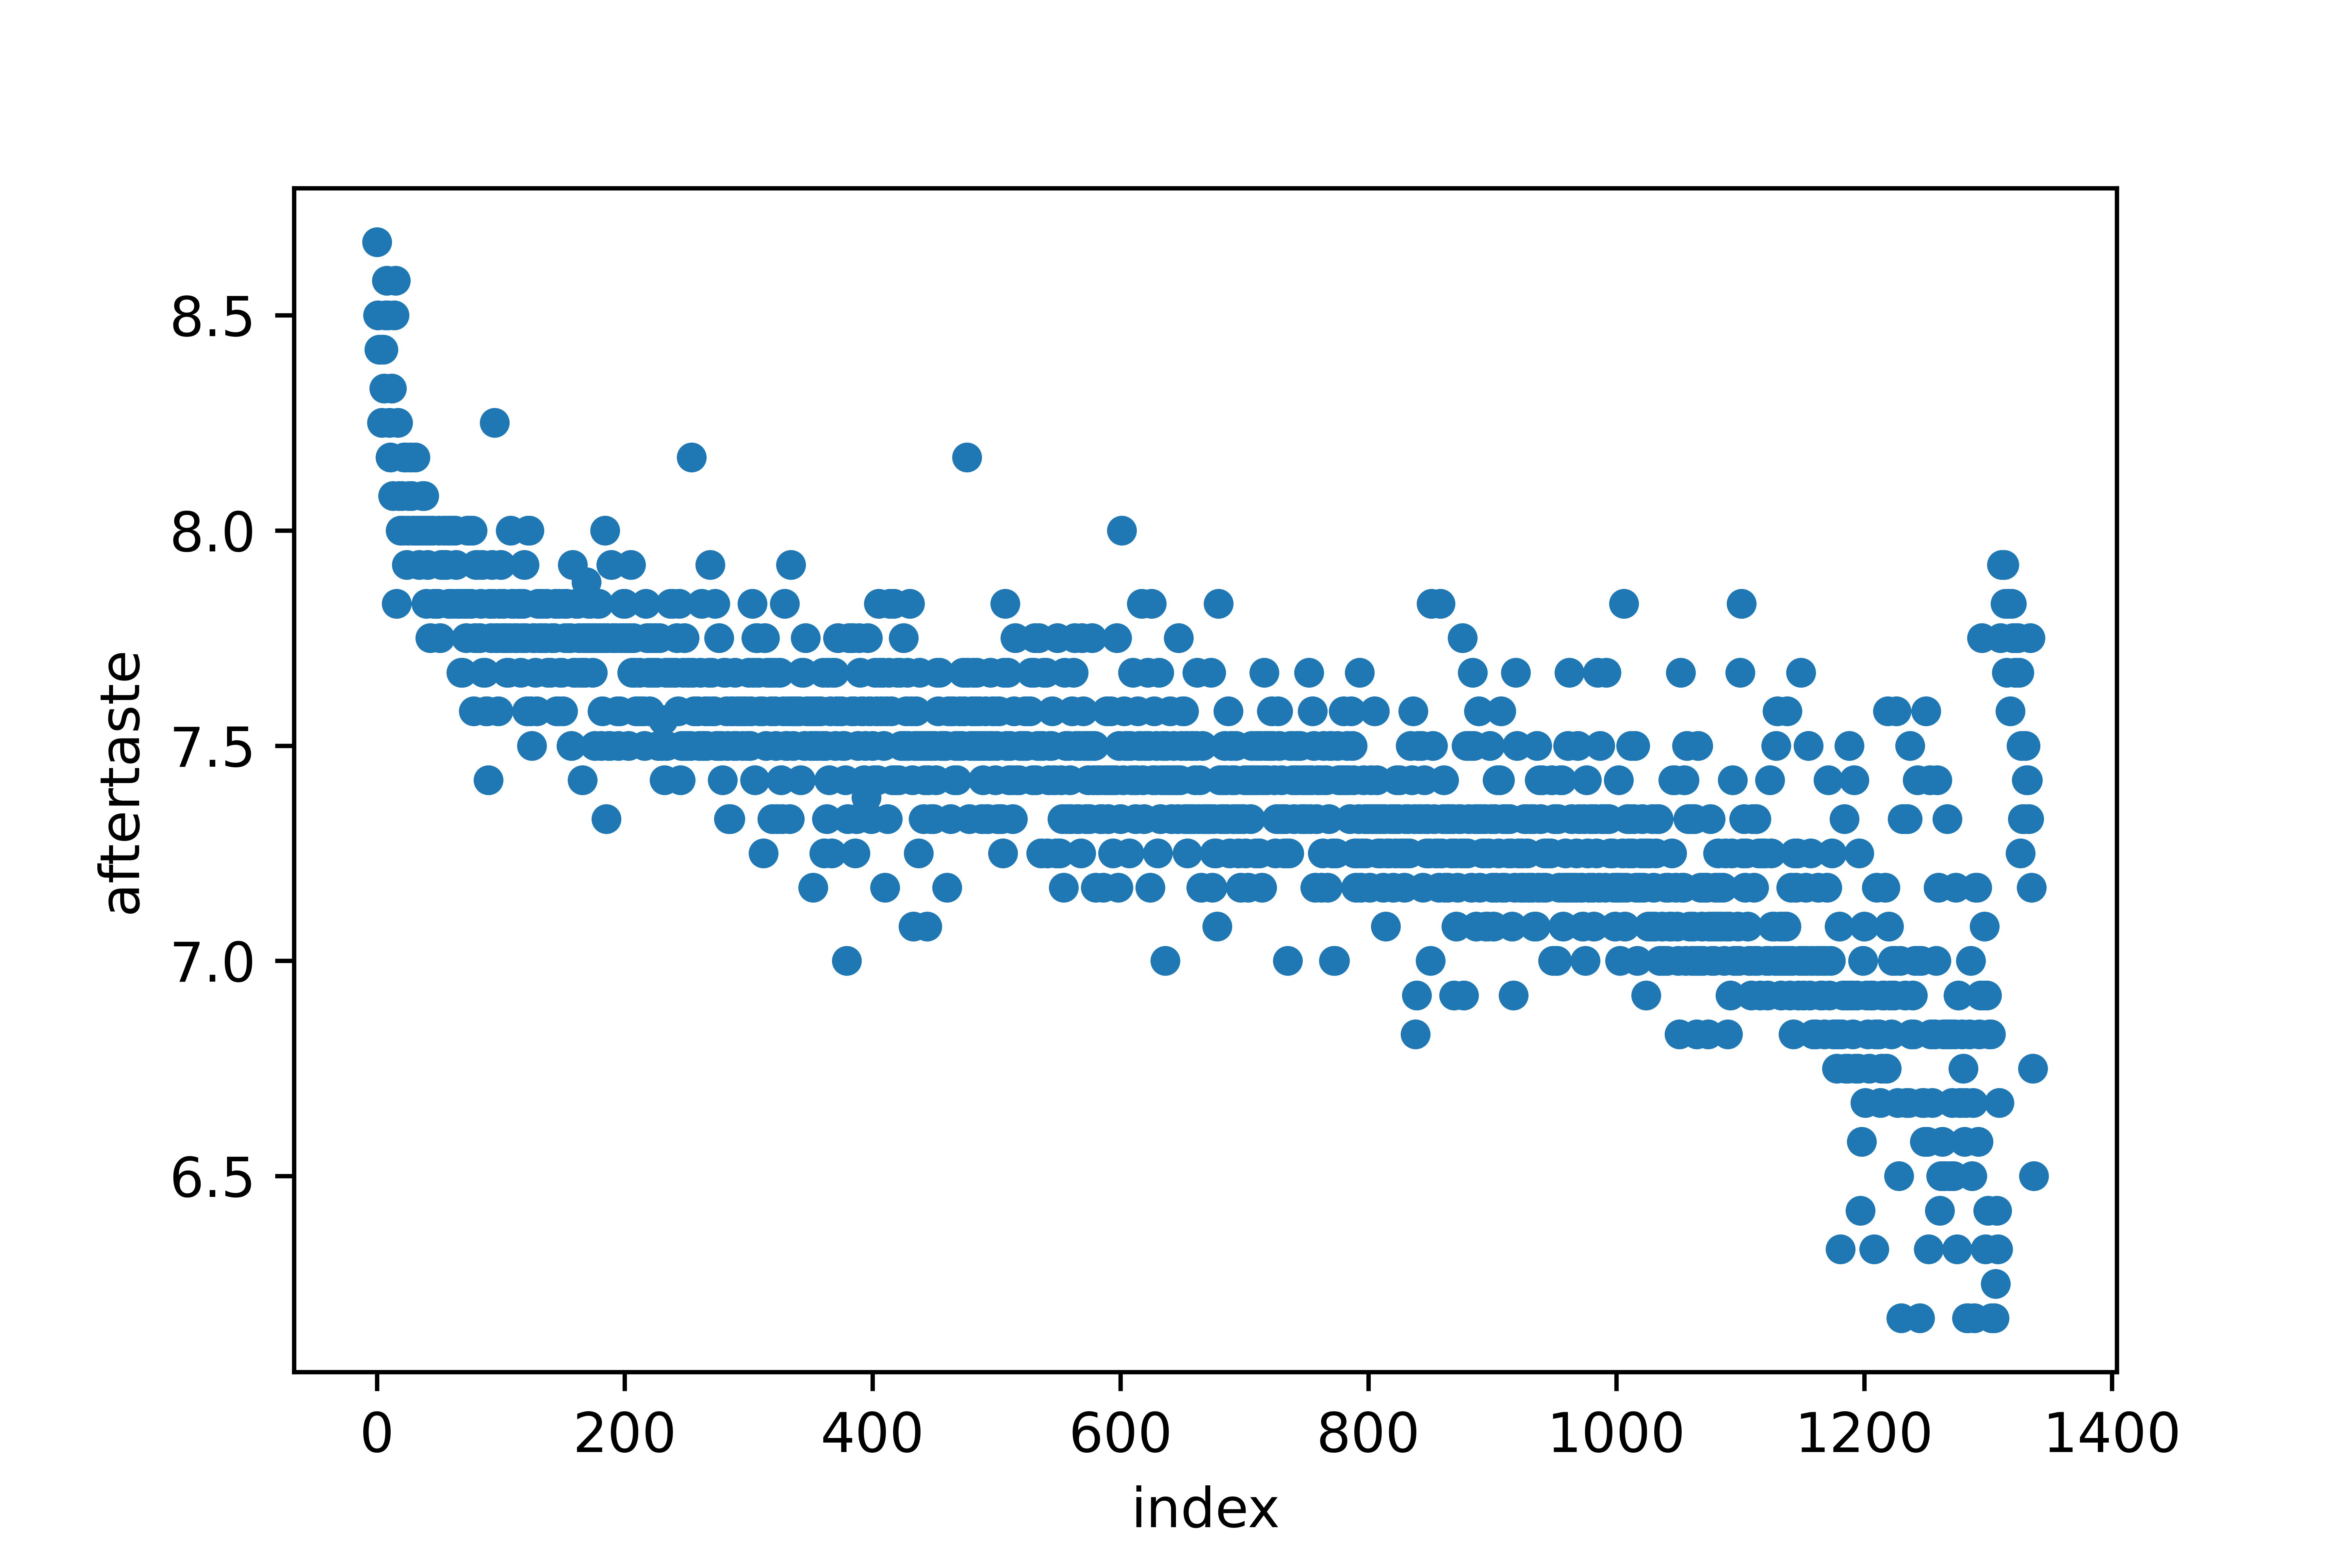
仅当我们在此扫描图中看不到模式时,系统抽样才是安全的。为确保系统采样安全,我们需要打乱样本
# frac = 1 = 100%,相当于随机抽取100%的样本,相当于打乱
shuffled = coffee_ratings.sample(frac=1)
shuffled = shuffled.reset_index(drop=True).reset_index()
shuffled.plot(x="index", y="aftertaste", kind="scatter")
plt.show()
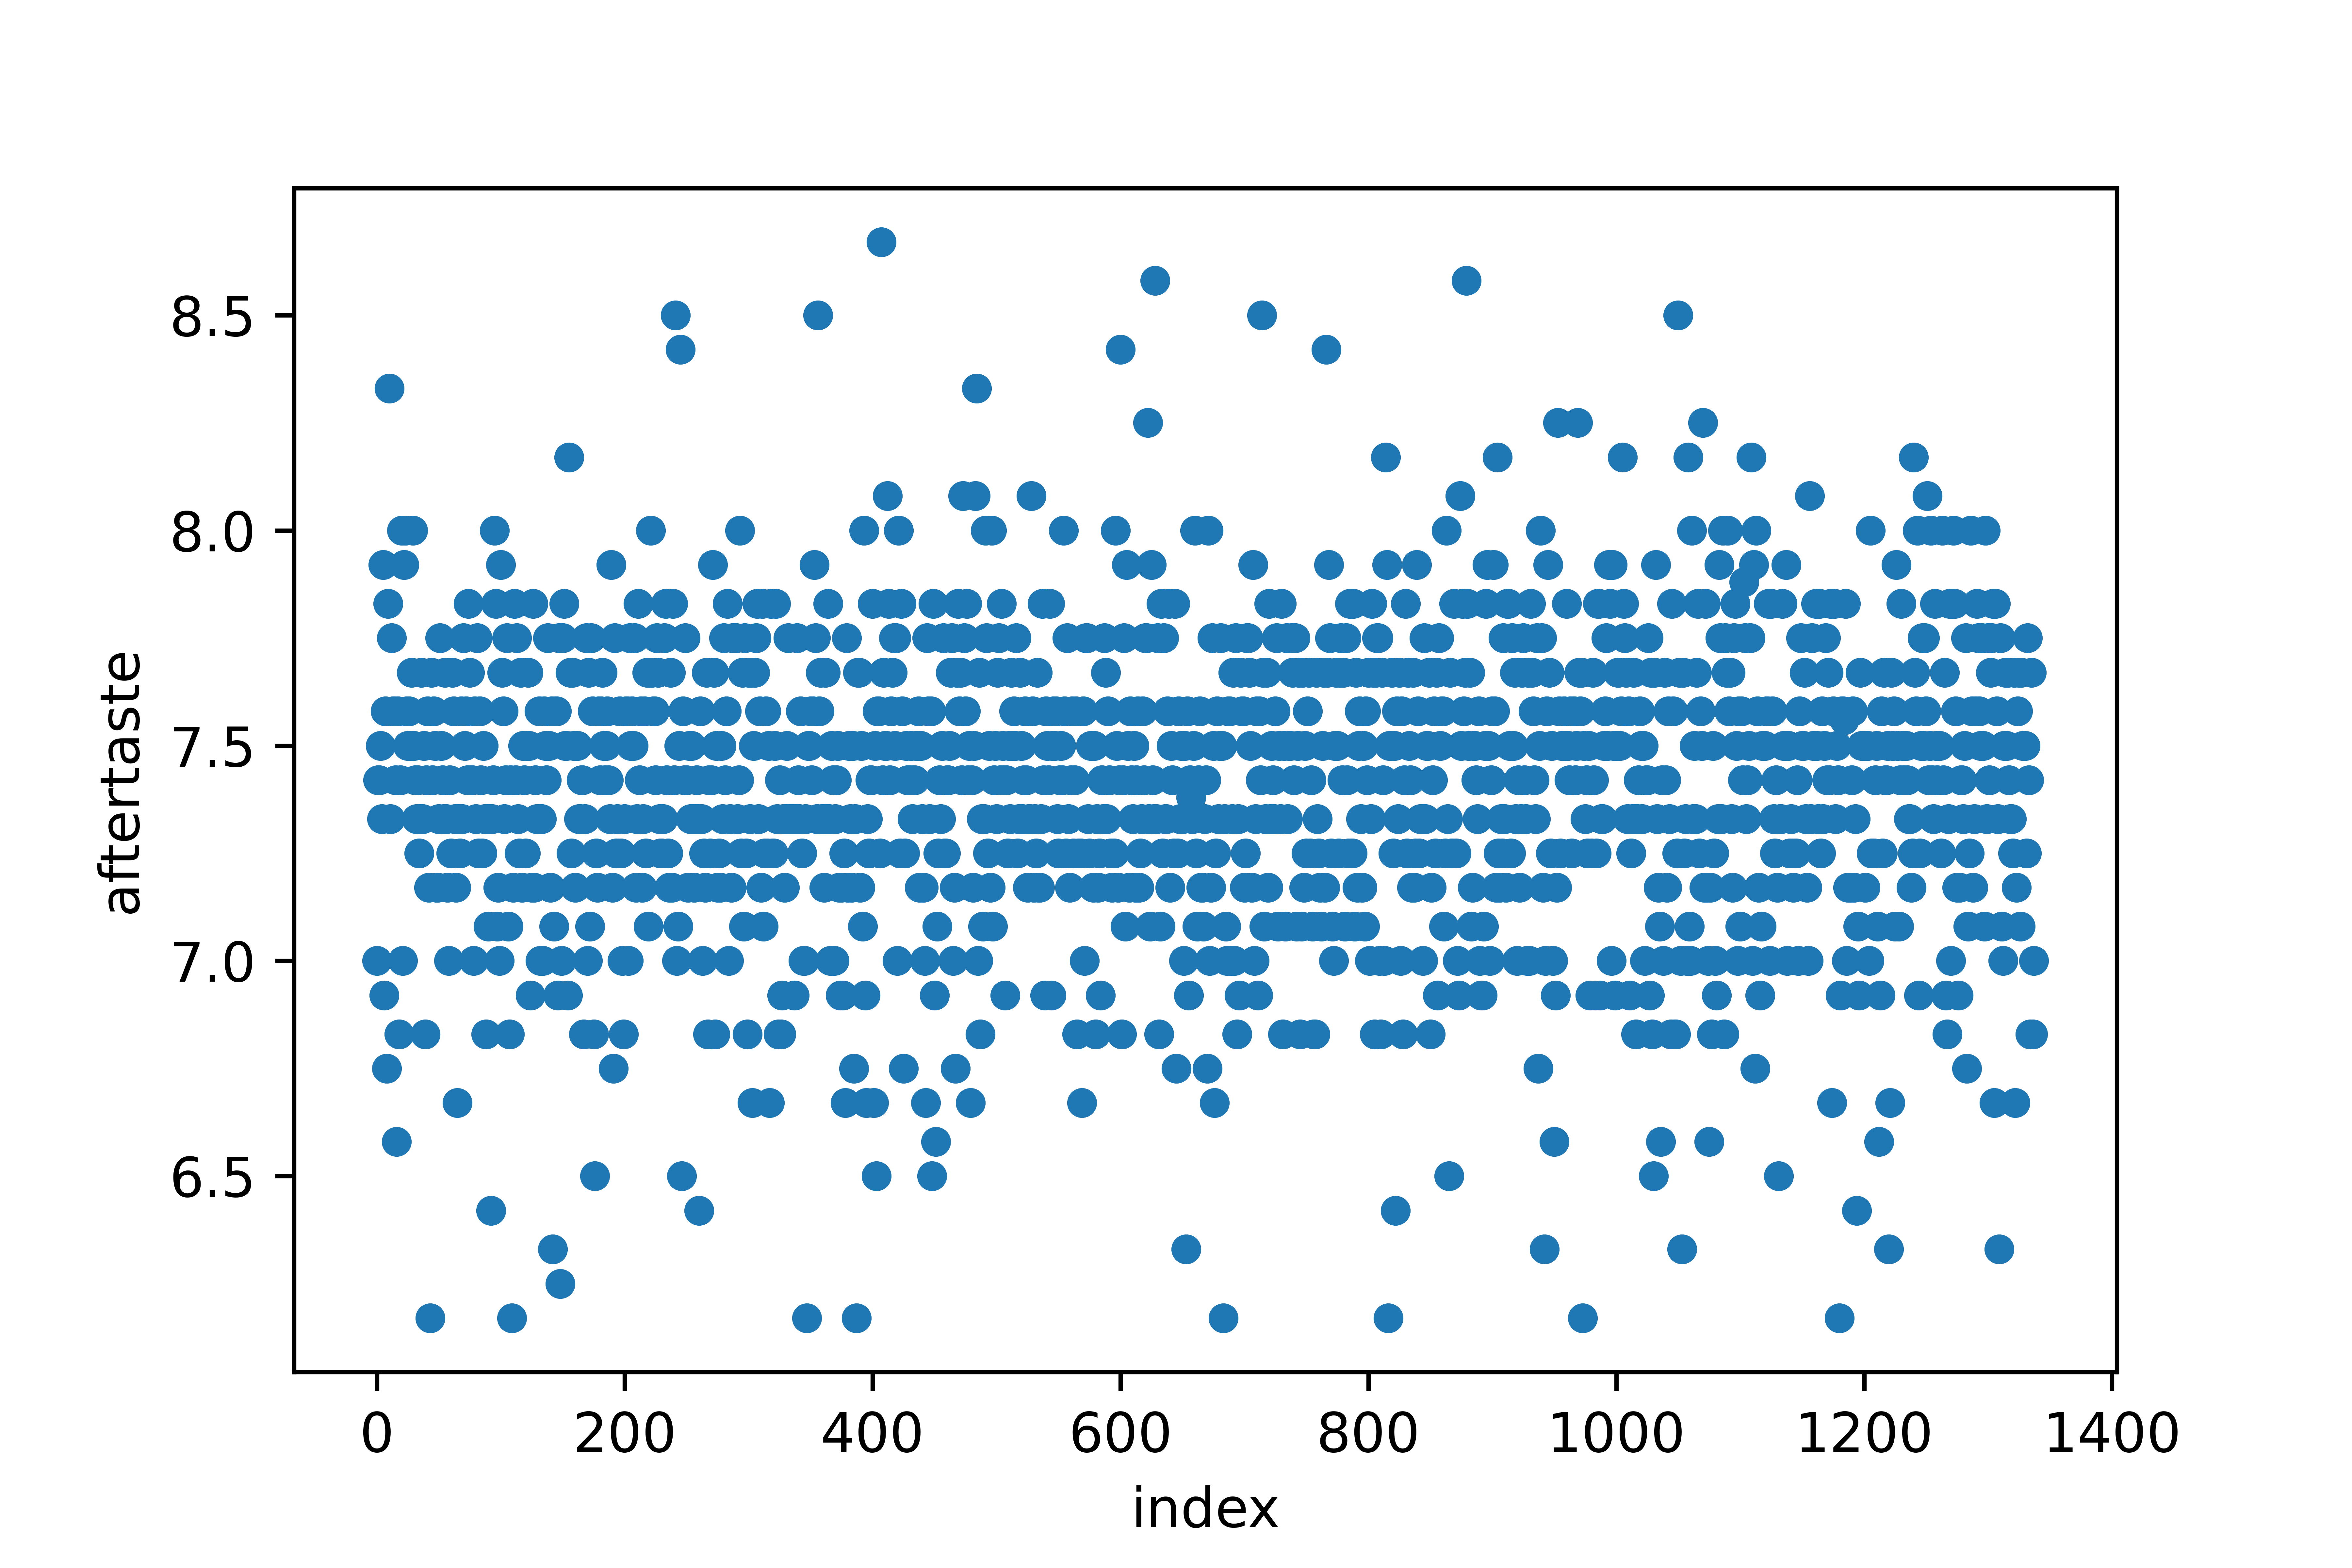
但,洗行+系统抽样 与 简单随机抽样 相同。
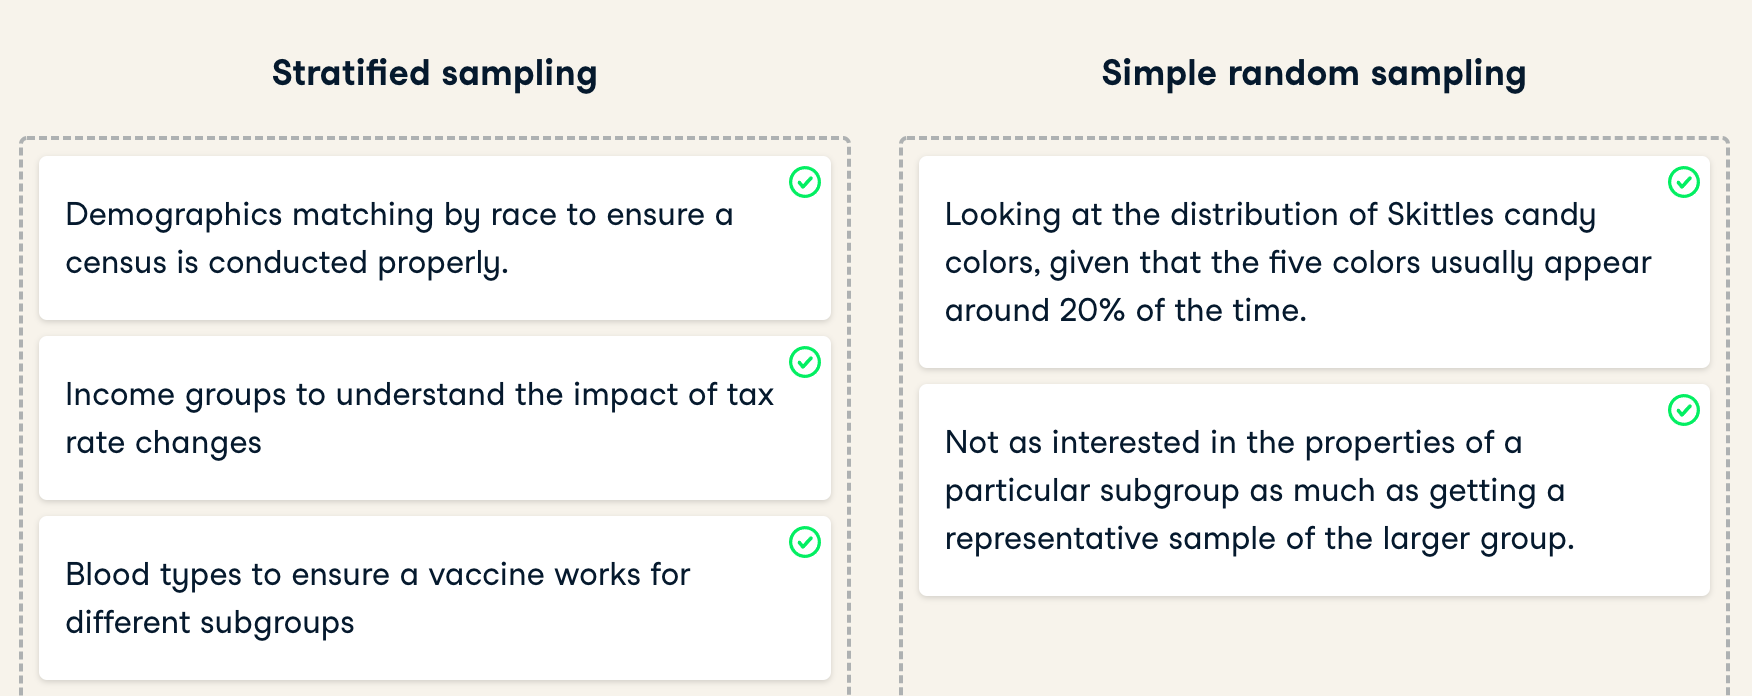
分层抽样
分层抽样「Stratified sampling」可以
- 按各种类占总体比例取样
- 对每种类取同样个数
- 自定义权重
如果您关心子组,分层抽样很有用。否则,简单随机抽样更为合适。
用途
- 政治投票
- 计算加权平均数
按比例抽样
其实即使不分层,抽样结果依旧是接近按按各种类占总体比例取样。不过,为了让结果完全按照比例取样,需要
# Proportion of employees by Education level
education_counts_pop = attrition_pop['Education'].value_counts(normalize=True)

# Print education_counts_pop
print(education_counts_pop)

# Proportional stratified sampling for 40% of each Education group
attrition_strat = attrition_pop.groupby('Education').sample(frac=0.4, random_state=2022)

# Calculate the Education level proportions from attrition_strat
education_counts_strat = attrition_strat['Education'].value_counts(normalize=True)

# Print education_counts_strat
print(education_counts_strat)
<script.py> output:
    Bachelor         0.389
    Master           0.271
    College          0.192
    Below_College    0.116
    Doctor           0.033
    Name: Education, dtype: float64
    Bachelor         0.389
    Master           0.270
    College          0.192
    Below_College    0.116
    Doctor           0.032
    Name: Education, dtype: float64
每种取同样个数
# Get 30 employees from each Education group
attrition_eq = attrition_pop.groupby('Education').sample(n=30, random_state=2022)

# Get the proportions from attrition_eq
education_counts_eq = attrition_eq["Education"].value_counts(normalize = True)

# Print the results
print(education_counts_eq)
<script.py> output:
    Below_College    0.2
    College          0.2
    Bachelor         0.2
    Master           0.2
    Doctor           0.2
    Name: Education, dtype: float64
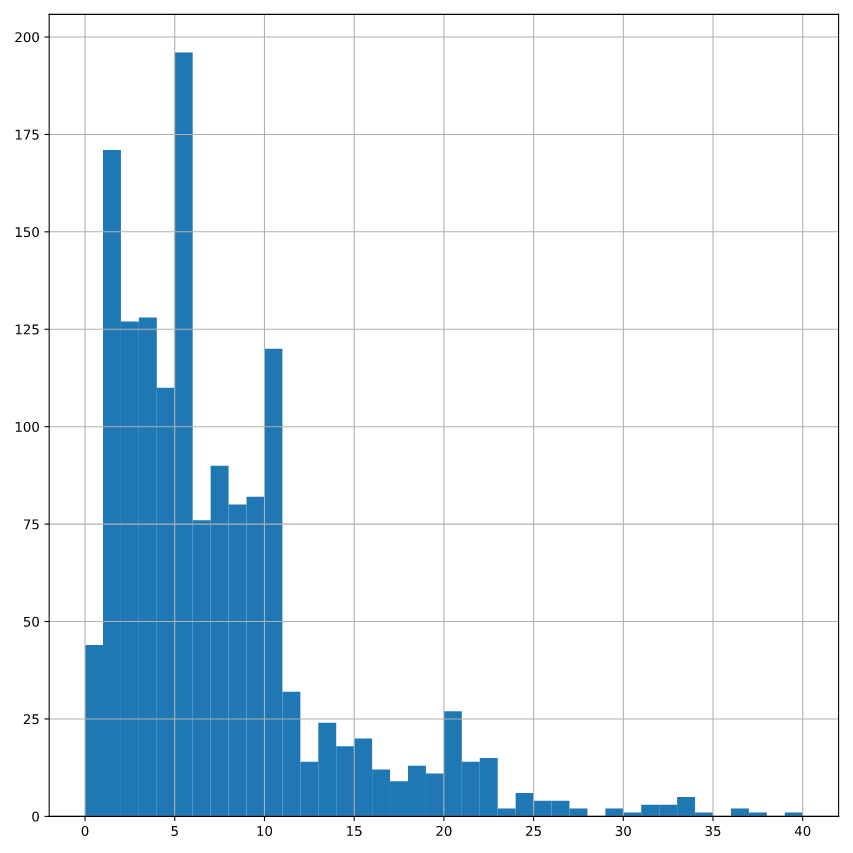
自定义权重
# Plot YearsAtCompany from attrition_pop as a histogram
attrition_pop['YearsAtCompany'].hist(bins=np.arange(0, 41, 1))
plt.show()
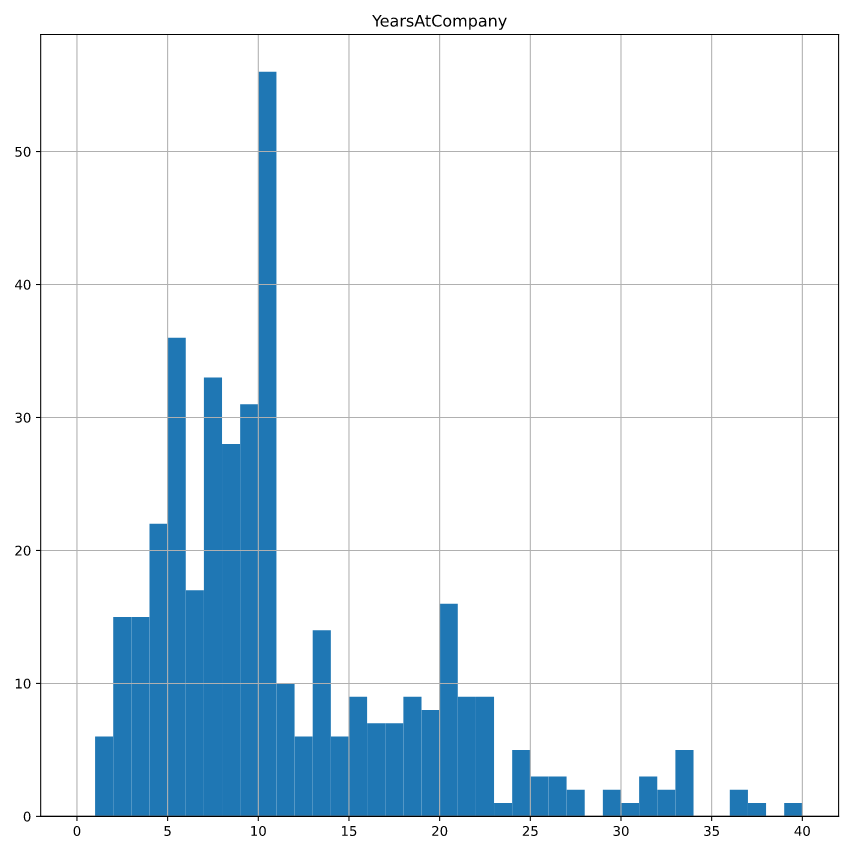
# Sample 400 employees weighted by YearsAtCompany
attrition_weight = attrition_pop.sample(n=400, weights="YearsAtCompany")
# Plot YearsAtCompany from attrition_weight as a histogram
attrition_weight.hist("YearsAtCompany",bins = np.arange(0,41,1))
plt.show()
分组抽样
分层抽样的一个问题是,我们需要收集每一个子群体的数据。在收集数据很昂贵的情况下,例如,当我们必须亲自到某个地方去收集数据时,就会使我们的分析费用过高。有一种更便宜的替代方法,叫做分组抽样。
# Create a list of unique JobRole values
job_roles_pop = list(attrition_pop['JobRole'].unique())

# Randomly sample four JobRole values
job_roles_samp = random.sample(job_roles_pop, k=4)

# Filter for rows where JobRole is in job_roles_samp
jobrole_condition = attrition_pop['JobRole'].isin(job_roles_samp)
attrition_filtered = attrition_pop[jobrole_condition]

# Remove categories with no rows
attrition_filtered['JobRole'] = attrition_filtered['JobRole'].cat.remove_unused_categories()

# Randomly sample 10 employees from each sampled job role
attrition_clust = attrition_filtered.groupby('JobRole').sample(n = 10, random_state = 2022)

# Print the sample
print(attrition_clust)