Linear Relationship
大约 7 分钟
Linear Relationship
线性回归/单变量一次方回归
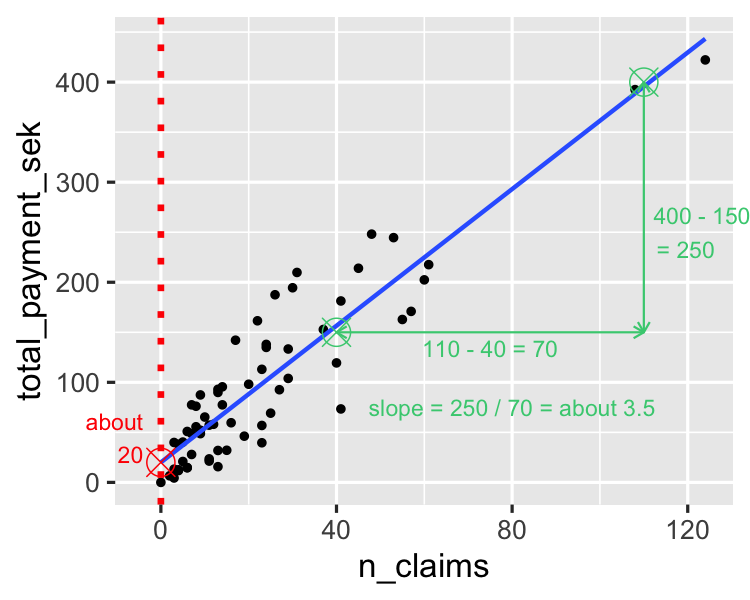
我们可以使用 linregress() 的结果来计算两个series的最佳拟合线。
有时候我们会非常地关心斜率,也就是变化率
from scipy.stats import linregress

# Extract the variables
# linregress() 无法处理 Nan 值
subset = brfss.dropna(subset=['INCOME2', '_VEGESU1'])
# series1 & series 2
# xs 作为自变量, ys 作为待预测的属性
xs = subset["INCOME2"]
ys = subset["_VEGESU1"]

# Compute the linear regression
res = linregress(xs, ys)
print(res)
LinregressResult(slope=0.06988048092105019,
                 intercept=1.5287786243363106,
                 rvalue=0.11967005884864099,
                 pvalue=1.378503916248713e-238,
                 stderr=0.002110976356332333,
                 intercept_stderr=0.013196467544093607)
现在只需关心前两个值
- slope 斜率
- intercept 纵截距
即回归函数为y = slope * x + intercept
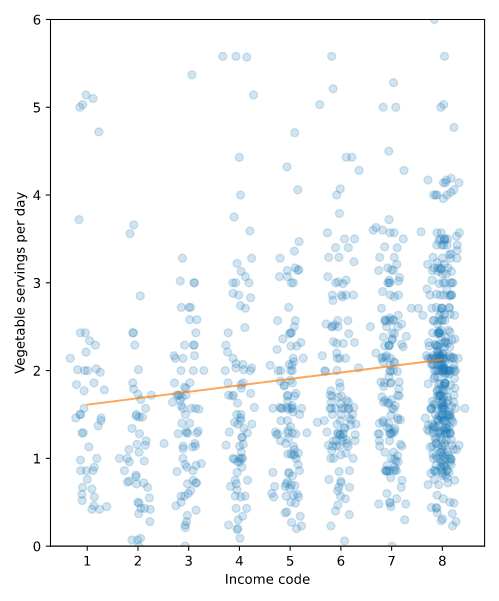
通常,在这之后我们需要将 拟合的直线 与 数据分布点/线 放到一张图中。
# Plot the scatter plot
# 数据分布图
plt.clf()
x_jitter = xs + np.random.normal(0, 0.15, len(xs))
plt.plot(x_jitter, ys, 'o', alpha=0.2)

# Plot the line of best fit
# 拟合的线
fx = np.array([xs.min(), xs.max()])
fy = res.intercept + res.slope * fx
plt.plot(fx, fy, '-', alpha=0.7)

plt.xlabel('Income code')
plt.ylabel('Vegetable servings per day')
plt.ylim([0, 6])
plt.show()
使用 statsmodels.formula.api 进行单变量回归
普通最小二乘法(OLS,ordinary least squares)
import statsmodels.formula.api as smf
# INCOME2 作为待预测属性(y), _VEGESU1 作为自变量(x)
results = smf.ols('INCOME2 ~ _VEGESU1', data=brfss).fit()
print(results.params)
Intercept 5.399903
 _VEGESU1 0.232515
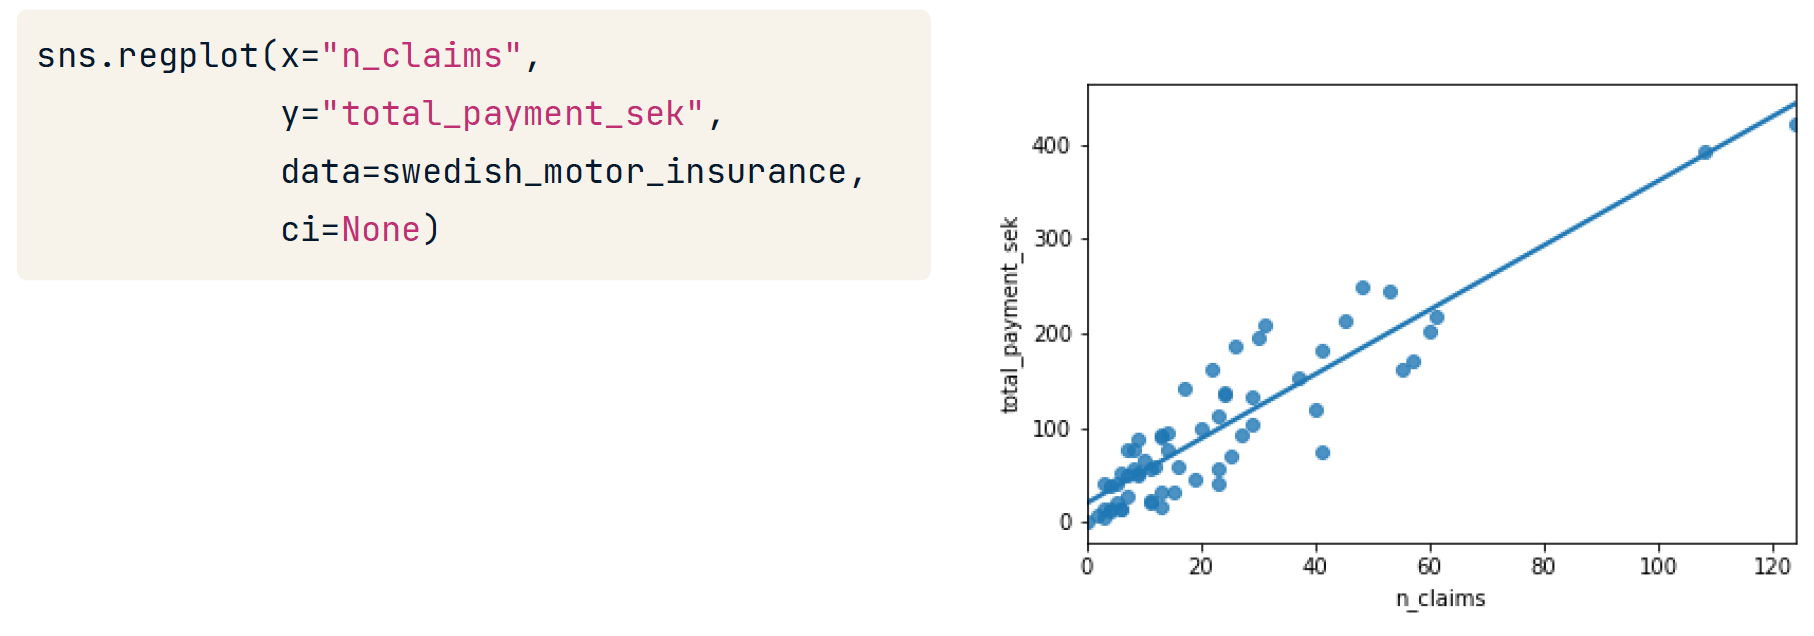
使用sns.regplot() 绘图
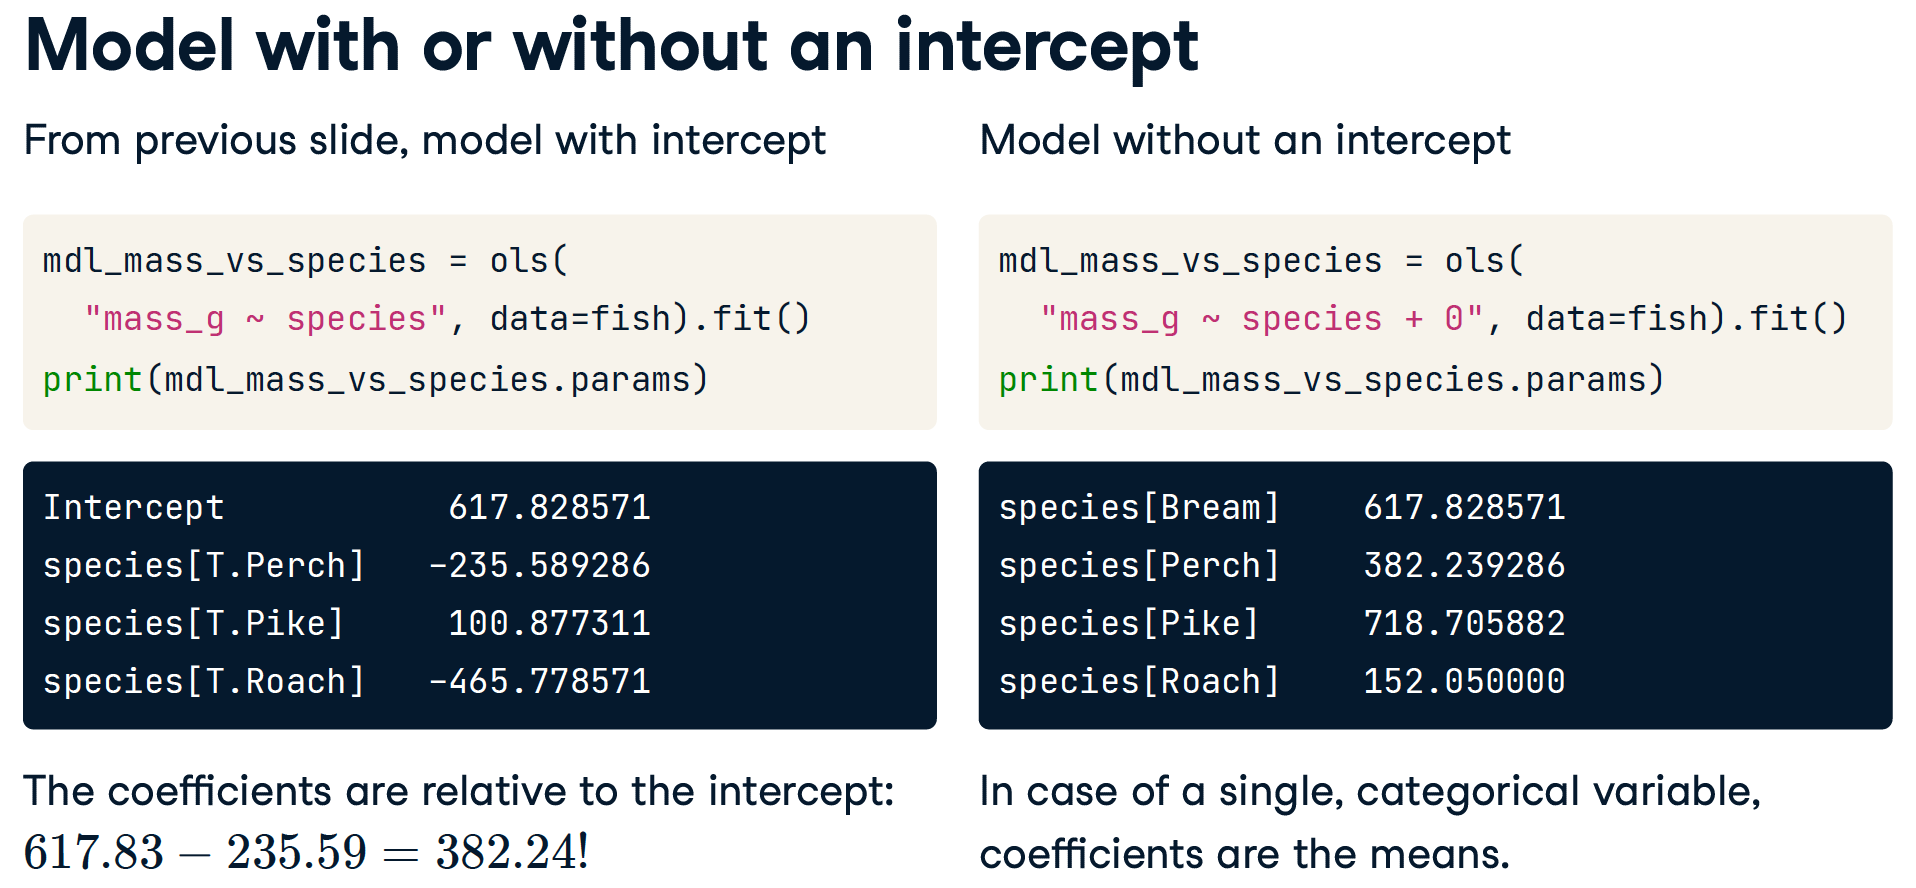
使用 ols 把 分类数据 当做 x
相当于求每一类的平均值......
转换变量
转换x
Transforming variables 使得线性回归模型具有拟合非线性数据的能力。
不妨 让 x = x2, 实现单元非线性回归
我们只需让
xs = subset["INCOME2"] ** 2- 绘图时需要注意不是线性,要多次取点画图,而不是最大最小值。
转换 x 和 y
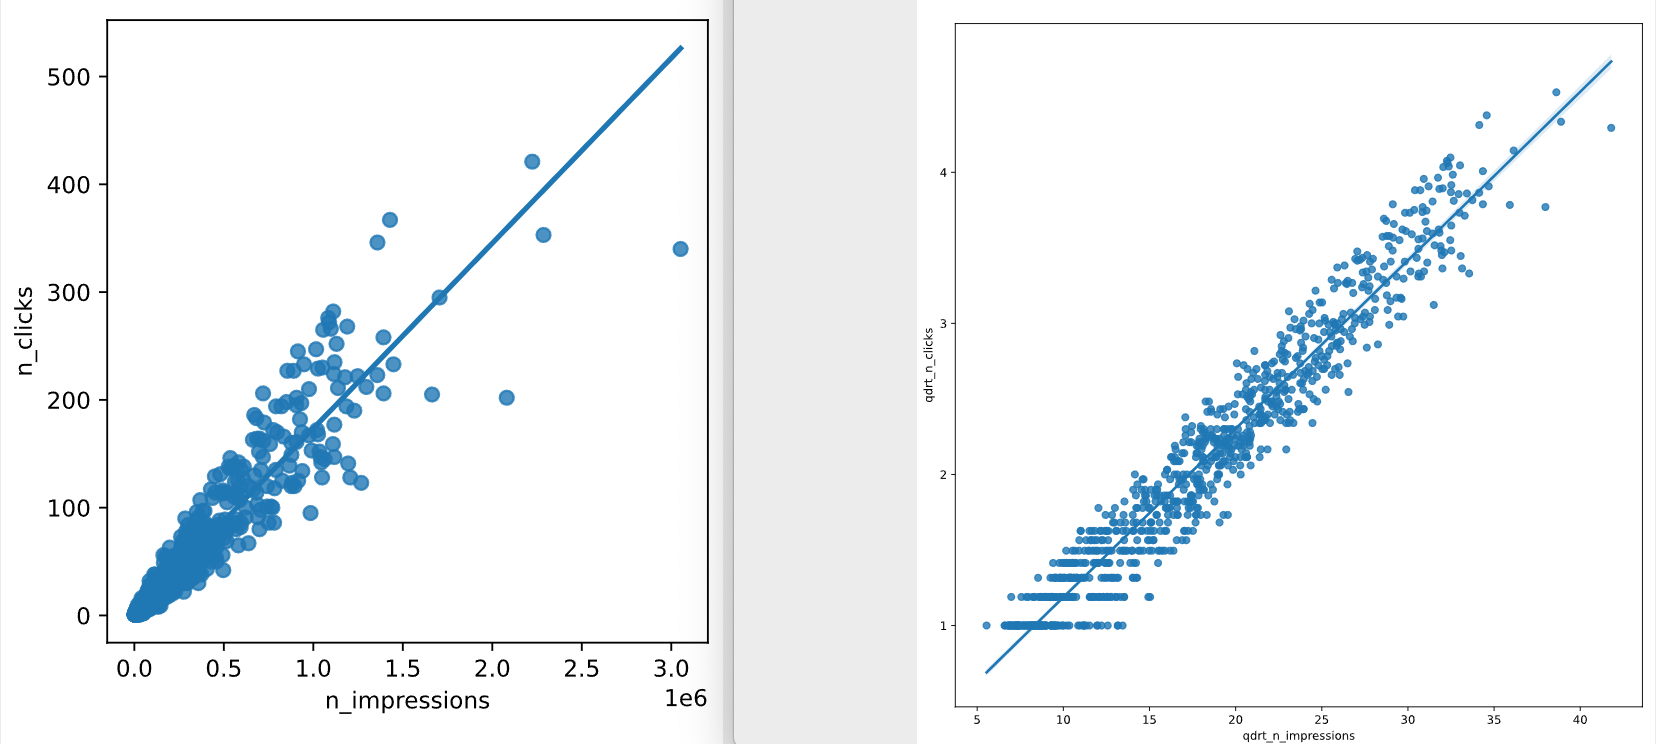
如果我们绘制标准图,大部分点都被塞进了图的左下角,因此很难评估是否有合适的拟合。
通过对两个变量进行平方根的转换,数据在整个图中更加分散,而且点与线的关系相当密切。当你的数据具有右偏分布时,平方根是一种常见的转换。
解释左偏和右偏
- 样本从左到右变得更加稀疏:右偏分布
- 样本从右到左变得更加稀疏:左偏分布
# Create qdrt_n_impressions and qdrt_n_clicks
ad_conversion["qdrt_n_impressions"] = ad_conversion["n_impressions"]  ** 0.25

ad_conversion["qdrt_n_clicks"] = ad_conversion["n_clicks"] ** 0.25

plt.figure()

# Plot using the transformed variables
sns.regplot(x = "qdrt_n_impressions", y = "qdrt_n_clicks", data = ad_conversion)
plt.show()
转换后,左图将变化到右图。
单变量多次方回归
不妨 让 x = x2, 实现单元非线性回归