Logistic regression
Logistic regression
Numerical or Categorical
- Numerical variables: income, age, years of education.
- Categorical variables: sex, race.
- 多种(1,2,3,4 表示)
- 两种 (Boolean variable):布尔(0,1 或者 -1,1 表示)
因此,将 Categorical variables 用 数字代替后,其实就和 Numerical variables 的回归一样了。
Boolean variable
变量值只有0和1
Logistic regression 可用于对 Boolean variable 值的回归
# C(sex) 是一个函数,常用于Categorical variables,这里不过多解释。sex 可能是 1 或者 2
formula = 'gunlaw ~ age + age2 + educ + educ2 + C(sex)'
results = smf.logit(formula, data=gss).fit()
results.params
Intercept 1.653862
C(sex)		[T.2] 0.757249
age 			-0.018849
age2 			0.000189
educ 			-0.124373
educ2			0.006653
数据预览
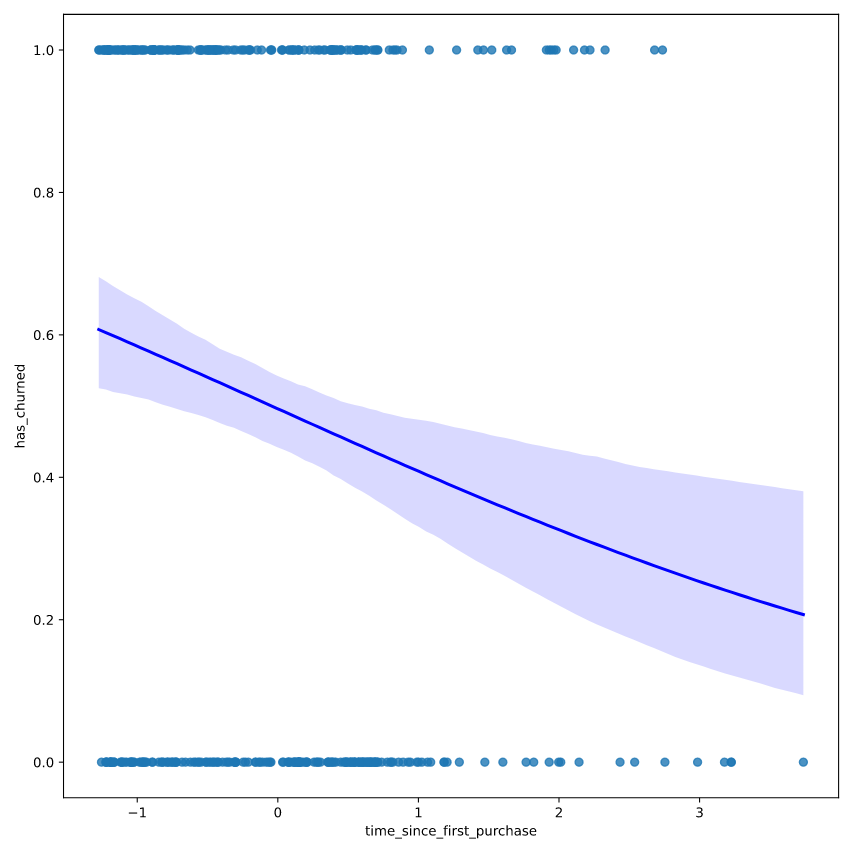
# Draw a logistic regression trend line and a scatter plot of time_since_first_purchase vs. has_churned
sns.regplot(x= "time_since_first_purchase", y = "has_churned", data = churn, logistic = True, line_kws={"color": "blue"})

plt.show()
预测和评估
df = pd.DataFrame()

df['age'] = np.linspace(18, 89)
df['educ'] = 12
df['age2'] = df['age']**2
df['educ2'] = df['educ']**2

df['sex'] = 1
pred1 = results.predict(df)
df['sex'] = 2
pred2 = results.predict(df)
数据可视化
案例1
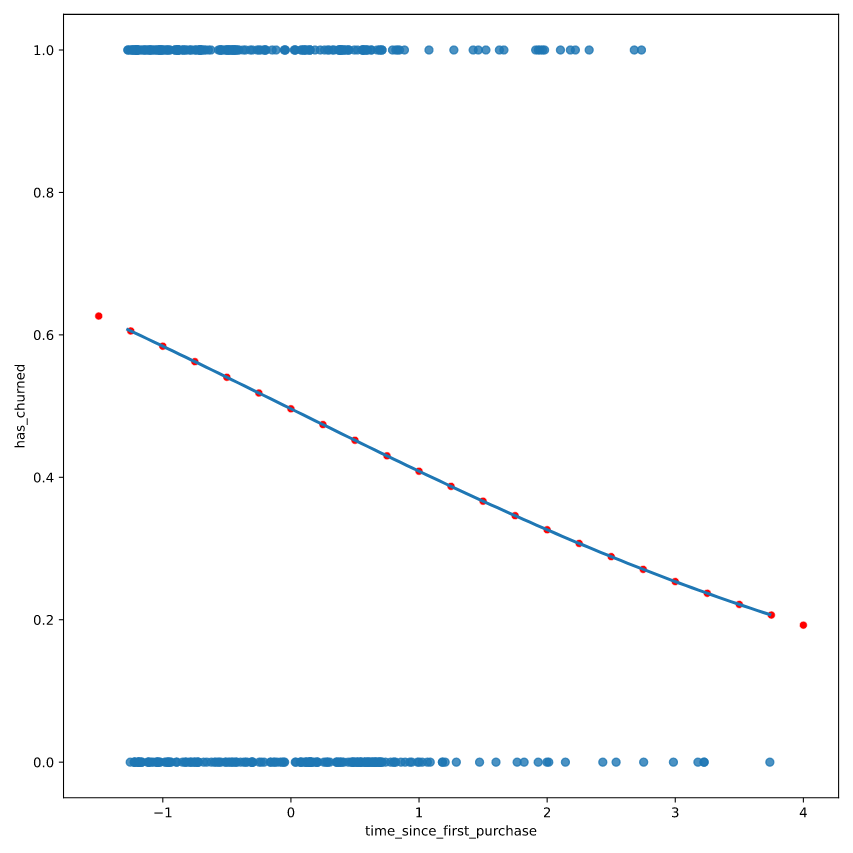
# Create prediction_data
prediction_data = explanatory_data.assign(
    has_churned = mdl_churn_vs_relationship.predict(explanatory_data)
)

fig = plt.figure()

# Create a scatter plot with logistic trend line
sns.regplot(x="time_since_first_purchase",
            y="has_churned",
            data=churn,
            ci=None,
            logistic=True)

# Overlay with prediction_data, colored red
sns.scatterplot(x="time_since_first_purchase",
                y="has_churned",
                data=prediction_data,
                color="red")

plt.show()
案例2
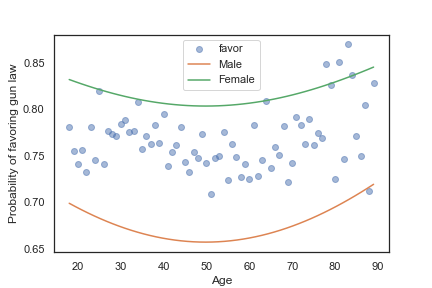
grouped = gss.groupby('age')
favor_by_age = grouped['gunlaw'].mean()
plt.plot(favor_by_age, 'o', alpha=0.5)

plt.plot(df['age'], pred1, label='Male')
plt.plot(df['age'], pred2, label='Female')

plt.xlabel('Age')
plt.ylabel('Probability of favoring gun law')
plt.legend()
到目前为止,我们只应用逻辑回归得到了概率,并没有预测是0,还是1。
Most likely outcome
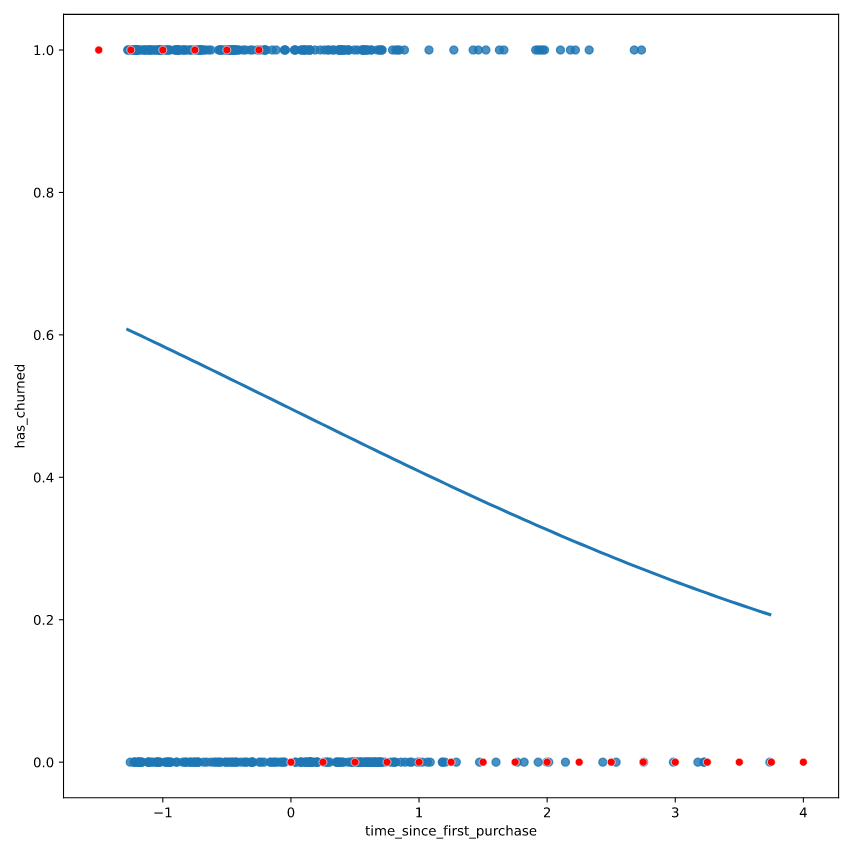
在向非技术人员解释您的结果时,您可能希望回避谈论概率并简单地解释最可能的结果。也就是说,与其说客户流失的可能性为 60%,不如说最有可能的结果是客户会流失。这里的权衡是更容易解释,但会以细微差别为代价。
通常认为 y < 0.5 时为0,否则为1.
# Update prediction data by adding most_likely_outcome
prediction_data["most_likely_outcome"] = np.round(prediction_data["has_churned"])

fig = plt.figure()

# Create a scatter plot with logistic trend line (from previous exercise)
sns.regplot(x="time_since_first_purchase",
            y="has_churned",
            data=churn,
            ci=None,
            logistic=True)

# Overlay with prediction_data, colored red
sns.scatterplot(x = "time_since_first_purchase", y = "most_likely_outcome" ,data = prediction_data, color = "red")

plt.show()
Odds ratios
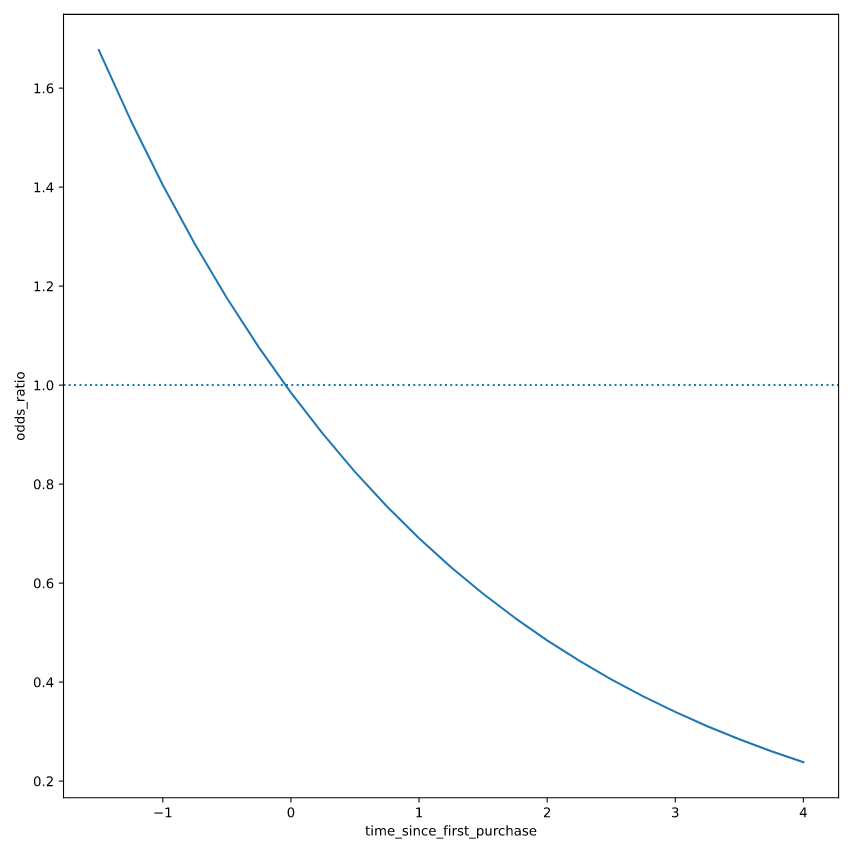
赔率是指事情发生的概率除以不发生的概率。
赔率比较某事发生的概率和不发生的概率。这有时比概率更容易推理,特别是当你想对选择做出决定时。例如,如果一个客户有20%的机会流失,说 "他们不流失的机会比他们流失的机会高四倍 "可能更直观。
prediction_data["odds_ratio"] = prediction_data["has_churned"] / (1 - prediction_data["has_churned"])
# Update prediction data with odds_ratio
prediction_data["odds_ratio"] = prediction_data["has_churned"] / (1 - prediction_data["has_churned"])

fig = plt.figure()

# Create a line plot of odds_ratio vs time_since_first_purchase
sns.lineplot(x = "time_since_first_purchase", y = "odds_ratio", data = prediction_data)

# Add a dotted horizontal line at odds_ratio = 1
plt.axhline(y=1, linestyle="dotted")

plt.show()
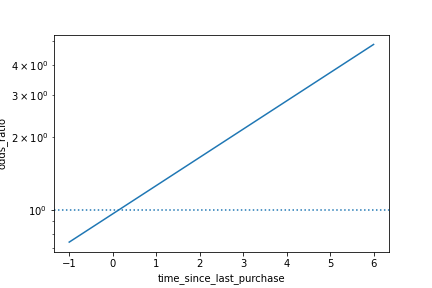
Visualizing log odds ratio
sns.lineplot(x="time_since_last_purchase", y="odds_ratio", data=prediction_data)
plt.axhline(y=1, linestyle="dotted")
plt.yscale("log")
plt.show()
Summary


Quantifying fit
我们为线性模型绘制的诊断图在逻辑案例中的用处不大。相反,我们将研究混淆矩阵。
混淆矩阵(有时称为混淆表)是具有分类响应(例如逻辑回归)的模型的所有性能指标的基础。它包含每个实际响应的计数 - 预测响应对。在这种情况下,如果有两种可能的响应(流失或不流失),则有四种总体结果。

表格记录了 预测是否正确 和 预测的阴阳 。
- True positive: The customer churned and the model predicted they would.
- False positive: The customer didn't churn, but the model predicted they would.
- True negative: The customer didn't churn and the model predicted they wouldn't.
- False negative: The customer churned, but the model predicted they wouldn't.
# Get the actual responses
actual_response = churn["has_churned"]

# Get the predicted responses
predicted_response = np.round(mdl_churn_vs_relationship.predict())

# Create outcomes as a DataFrame of both Series
outcomes = pd.DataFrame({"actual_response": actual_response,
                         "predicted_response": predicted_response})

# Print the outcomes
print(outcomes.value_counts(sort = False))
<script.py> output:
    actual_response  predicted_response
    0                0.0                   112
                     1.0                    88
    1                0.0                    76
                     1.0                   124
    dtype: int64
虽然计算性能矩阵可能很有趣,但如果你需要不同模型的多个混淆矩阵,它就会变得很乏味。幸运的是,.pred_table()方法可以为你计算出混淆矩阵。
# Import mosaic from statsmodels.graphics.mosaicplot
from statsmodels.graphics.mosaicplot import mosaic

# Calculate the confusion matrix conf_matrix
conf_matrix = mdl_churn_vs_relationship.pred_table()

# Print it
print(conf_matrix)

# Draw a mosaic plot of conf_matrix
mosaic(conf_matrix)
plt.show()
<script.py> output:
    [[112.  88.]
     [ 76. 124.]]
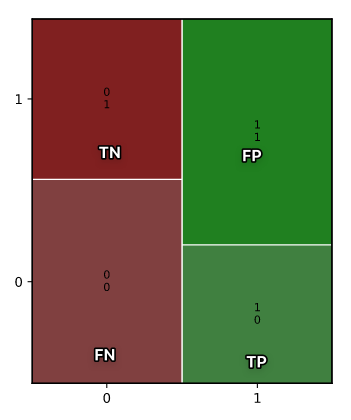
很多性能指标都可以从混淆矩阵中计算出来。对于逻辑回归来说,其中三个特别重要:准确性、敏感性和特异性。
Accuracy
准确率是正确预测的比例。这是正确预测的比例。也就是说,真正的阴性数加上真正的阳性数,除以总的观察数。准确率越高越好。

TN = conf_matrix[0,0]
TP = conf_matrix[1,1]
FN = conf_matrix[1,0]
FP = conf_matrix[0,1]

acc = (TN + TP) / (TN + TP + FN + FP)
print(acc)
0.575
Sensitivity & Specificity
- Sensitivity: is the proportion of true positives.
- 这是实际反应是真的观察结果的比例,其中模型也预测它们是真的。
- 也就是说,真阳性的数量 除以 假阴性和真阳性之和。
- Specificity: is the proportion of true negatives.
- 这是实际反应是错误的观察结果的比例,其中模型也预测它们是错误的。
- 也就是说,真阴性的数量 除以 真阴性和假阳性之和。
经常有一种权衡,即提高特异性会降低敏感性,或者提高敏感性会降低特异性。
# Calculate and print the sensitivity
sensitivity = TP / (TP + FN)
print("sensitivity: ", sensitivity)

# Calculate and print the specificity
specificity = TN / (TN + FP)
print("specificity: ", specificity)
<script.py> output:
    sensitivity:  0.62
    specificity:  0.56
