Logistic regression
大约 3 分钟
Logistic regression
Confusion matrix in sk
from sklearn.metrics import classification_report, confusion_matrix

knn = KNeighborsClassifier(n_neighbors=7)
X_train, X_test, y_train, y_test = train_test_split(X, y, test_size=0.4, random_state=42)
knn.fit(X_train, y_train)

y_pred = knn.predict(X_test)
print(confusion_matrix(y_test, y_pred))
[[1106 11]
[ 183 34]]
print(classification_report(y_test, y_pred))
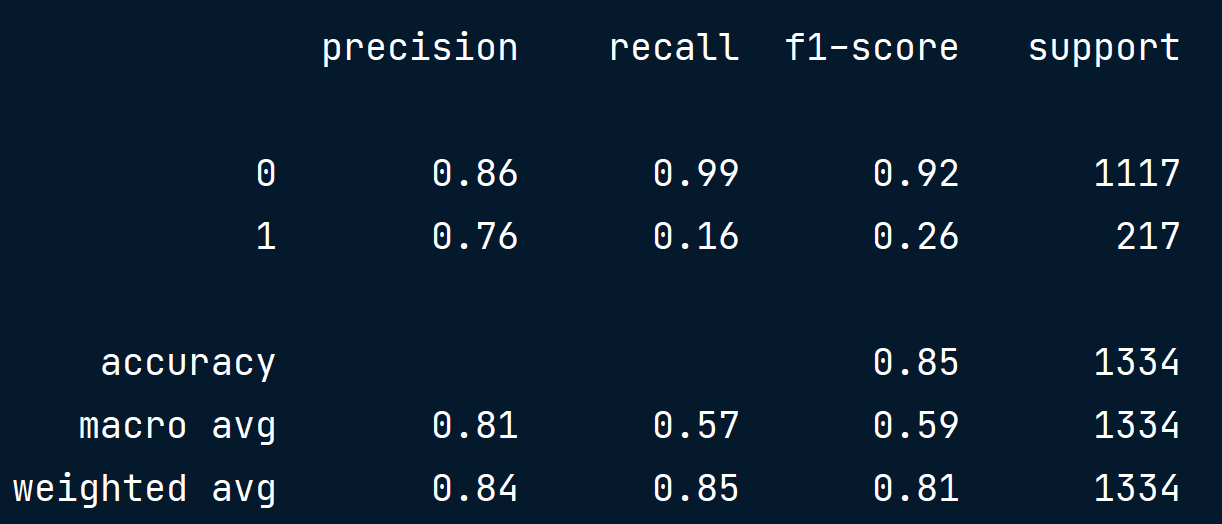
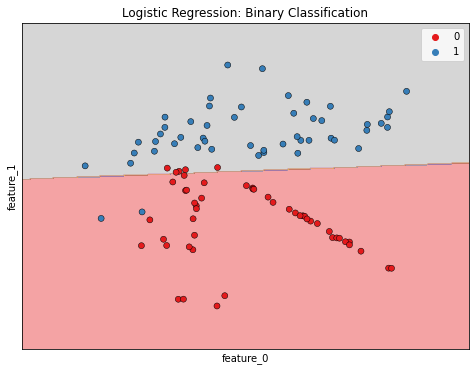
Binary Classification
- Logistic regression is used for classification problems
- Logistic regression outputs probabilities
- If the probability, p > 0.5: The data is labeled 1
- If the probability, p < 0.5: The data is labeled 0
from sklearn.linear_model import LogisticRegression

logreg = LogisticRegression()
X_train, X_test, y_train, y_test = train_test_split(X, y, test_size=0.3, random_state=42)
logreg.fit(X_train, y_train)

y_pred = logreg.predict(X_test)
y_pred_probs = logreg.predict_proba(X_test)[:, 1] # 第0个元素是false的概率,第1个是true的概率
print(y_pred_probs[:10])
[0.26551027 0.18336579 0.1211962 0.15613548 0.49611245 0.44582218 0.0135924 0.61646113 0.5564054 0.79311835]
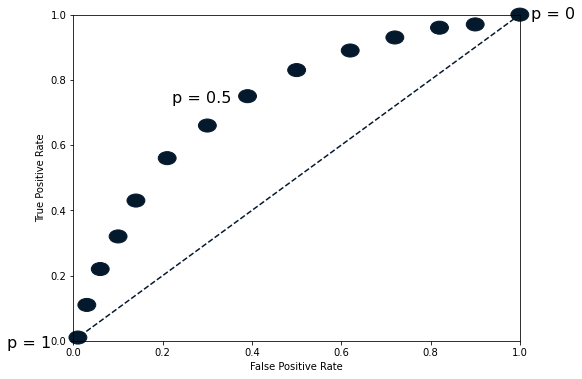
Probability thresholds
- By default, logistic regression threshold = 0.5
- Not specific to logistic regression, KNN classifiers also have thresholds
The ROC curve
from sklearn.metrics import roc_curve
fpr, tpr, thresholds = roc_curve(y_test, y_pred_probs)
plt.plot([0, 1], [0, 1], 'k--')
plt.plot(fpr, tpr)
plt.xlabel('False Positive Rate')
plt.ylabel('True Positive Rate')
plt.title('Logistic Regression ROC Curve')
plt.show()
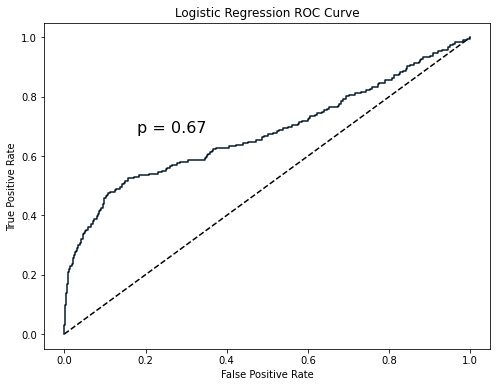
from sklearn.metrics import roc_auc_score
print(roc_auc_score(y_test, y_pred_probs))
0.6700964152663693
该数值是积分值。ROC 曲线在虚线上方,因此模型比随机猜测每个观察的类别表现更好。