Numpy
Numpy
What is Numpy
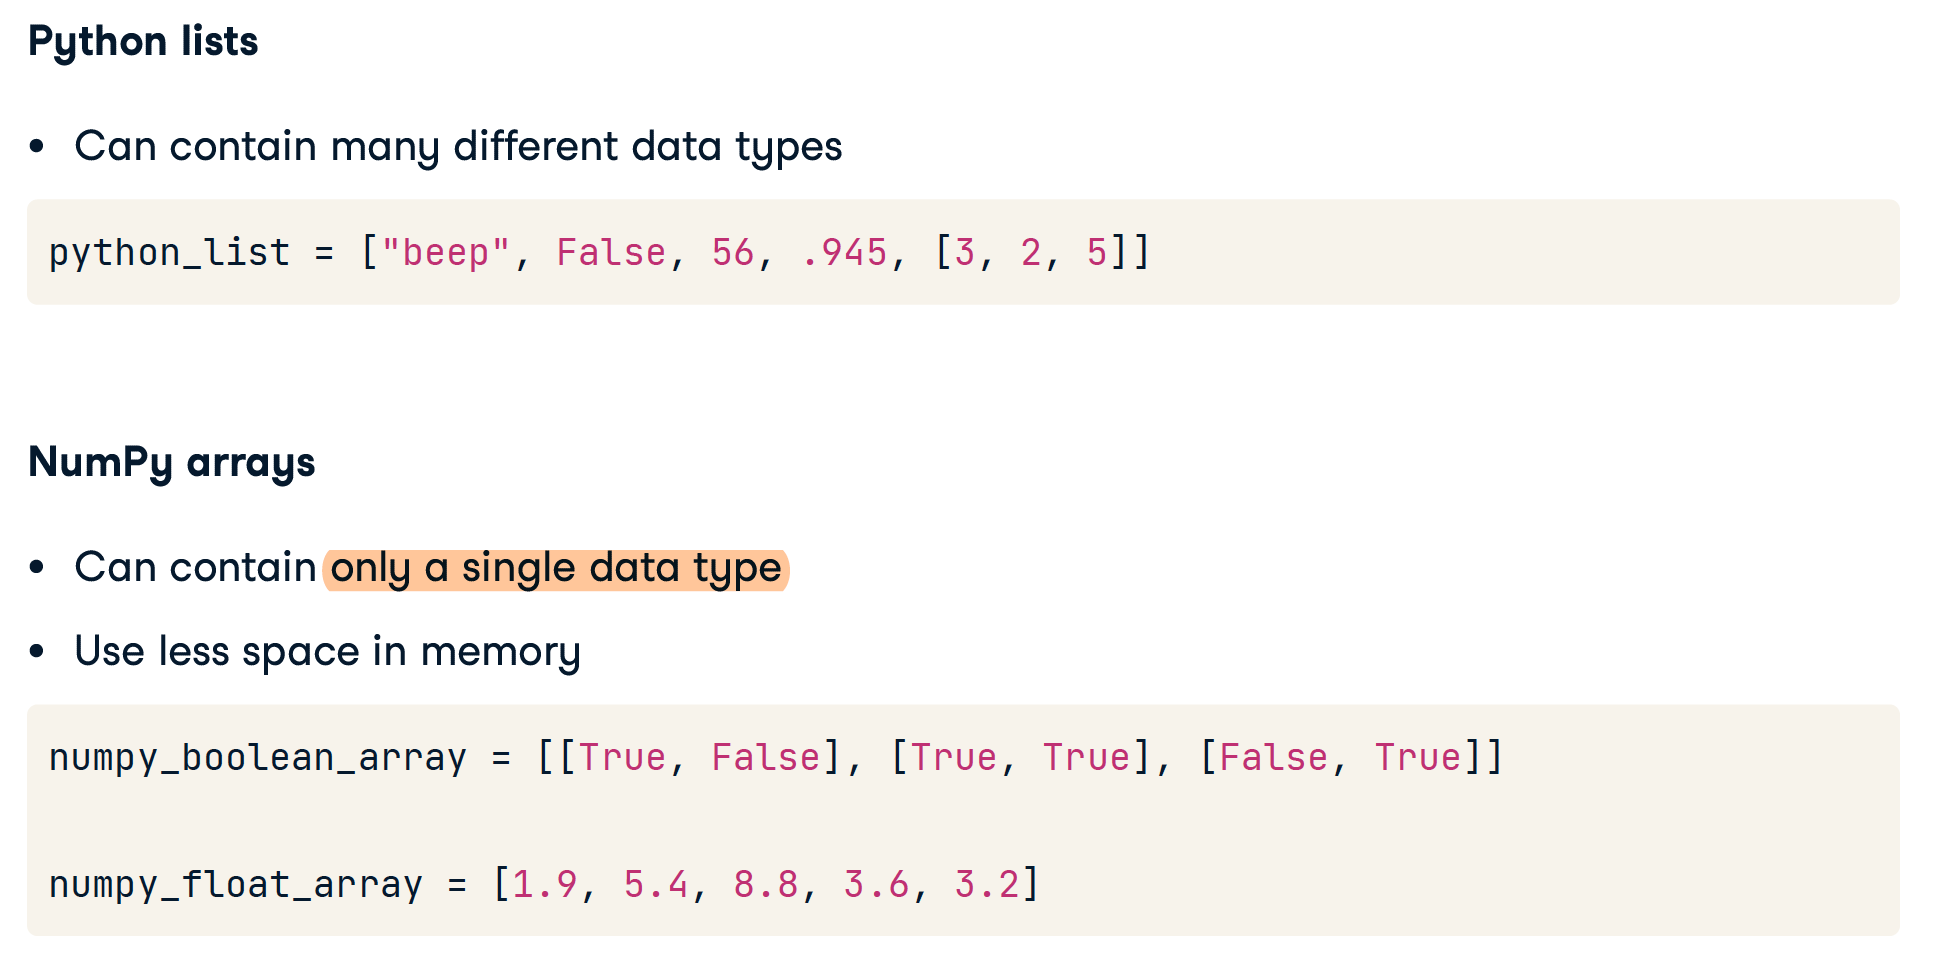
NumPy是Python中科学计算的核心库。诸如pandas、SciPy和Matplotlib等Python基础库都建立在NumPy的API之上。机器学习库也是如此,如TensorFlow和scikit-learn,它们使用NumPy数组作为输入。任何在Python中使用数字的人都会接触到NumPy数组.

Numpy (Numerical Python的缩写):
- 一个开源的Python科学计算库
- 使用Numpy可以方便的使用数组、炬年进行计算
- 包含线性代数、傅里叶变换、随机数生成等大量函数
Why Numpy
对于同样的数值计算任务,使用Numpy比直接编写Python代码实现,优点:
- 代码更简洁:Numpy直接以数组、矩阵为粒度计算并且支持大量的数学函数,而Python需要用for循环从底层实现
- 性能更高效:Numpy的数组存储效率和输入输出计算性能,比Python使用List或者嵌套List好很多
- 注:(Numpy的数据存储和Python,原生的List是不一样的)
- 注:Numpy的大部分代码都是C语言实现的,这是Numpyl比纯Python代码高效的原因
Numpy是Python各种数据科学类库的基础库
- 比如SciPy、Scikit-Learn、。Tensorflow、PaddlePaddle等
- 如果不会Numpy,这些库的深入理解都会遇到障碍
Numpy Basics
- 提供操作大型数值数据数组和矩阵的基本例程
- 元素表(通常为数字),所有元素类型相同,通过正整数元组索引
- Dimensions are called axes. Number of axes is rank.
- Coordinates of a point in 3D [1, 2, 1] is an array of rank 1 (1 axis). That axis has a length of 3.
- A 2⨉3 matrix [[1.0, 1.0, 2.0], [0.0, 2.0, 1.0]] has a rank of 2 (or 2 dimensions). First dimension (or axis) has length = 2; Second dimension (or axis) has length = 3
- Assignment of Numpy Array is just a Reference Copy
Numpy Array Dimensions
a = np.array(42.)
# a: 0 () float64
b = np.array([1, 2, 3, 4, 5])
# b: 1 (5,) int64
c = np.array([[1, 2, 3], [4, 5, 6]])
# c: 2 (2, 3) int64
d = np.array([[[1, 2, 3], [4, 5, 6]], [[1, 2, 3], [4, 5, 6]]])
# d: 3 (2, 2, 3) int64

print('a:', a.ndim, ' ', a.shape, ' ', a.dtype)
print('b:', b.ndim, ' ', b.shape, ' ', b.dtype)
print('c:', c.ndim, ' ', c.shape, ' ', c.dtype)
print('d:', d.ndim, ' ', d.shape, ' ', d.dtype)

print("length of d's first axis =", len(d))
# length of d's first axis = 2
print("length of d's second axis =", len(d[0]))
# length of d's second axis = 2
Cerate np array
Create empty array
import numpy as np
data = np.array()
Creating 1D arrays from lists
python_list = [3, 2, 5, 8, 4, 9, 7, 6, 1]
array = np.array(python_list)
print(array)
print(type(array))
array([3, 2, 5, 8, 4, 9, 7, 6, 1])
numpy.ndarray
Creating 2D arrays from lists
python_list_of_lists = [[3, 2, 5],[9, 7, 1],[4, 3, 6]]
np.array(python_list_of_lists)
array([[3, 2, 5],[9, 7, 1],[4, 3, 6]])
np.zeros()
# 先说行数,再说列数。即先y再x
np.zeros((5, 3))
array([[0., 0., 0.],
        [0., 0., 0.],
        [0., 0., 0.],
        [0., 0., 0.],
        [0., 0., 0.]])
np.random.random()
np.random.random((2, 4))
array([[0.88524516, 0.85641352, 0.33463107, 0.53337117],
[0.69933362, 0.09295327, 0.93616428, 0.03601592]])
np.arange()
np.arange(-3, 4)
np.arange(4)
array([-3, -2, -1, 0, 1, 2, 3])
array([0, 1, 2, 3])
这在创建图的x轴方面很好用。
# Create an array of integers from one to ten
one_to_ten = np.arange(1,11)
doubling_array = [1, 2, 4, 8, 16, 32, 64, 128, 256, 512]

# Create your scatterplot
plt.scatter(one_to_ten, doubling_array)
plt.show()
3D & 4D arrays
array_1_2D = np.array([[1, 2], [5, 7]])
array_2_2D = np.array([[8, 9], [5, 7]])
array_3_2D = np.array([[1, 2], [5, 7]])
array_3D = np.array([array_1_2D, array_2_2D, array_3_2D])

array_4D = [array_A_3D, array_B_3D, array_C_3D, array_D_3D, array_E_3D, array_F_3D, array_G_3D, array_H_3D, array_I_3D]
Create from pd
# Assign the filename: file
file = 'digits.csv'

# Read the first 5 rows of the file into a DataFrame: data
data = pd.read_csv(file).head()

# Build a numpy array from the DataFrame: data_array
data_array = data.value

# Print the datatype of data_array to the shell
print(type(data_array))
List Operations
List Operations can be used on Numpy Array
import numpy as np
a = np.array([1, 4, 5, 8])
print(a[:2])
print(a[3])
print(a[-1])
a[3] = 100
print(a)
print(type(a))
Matrix and tensor arrays
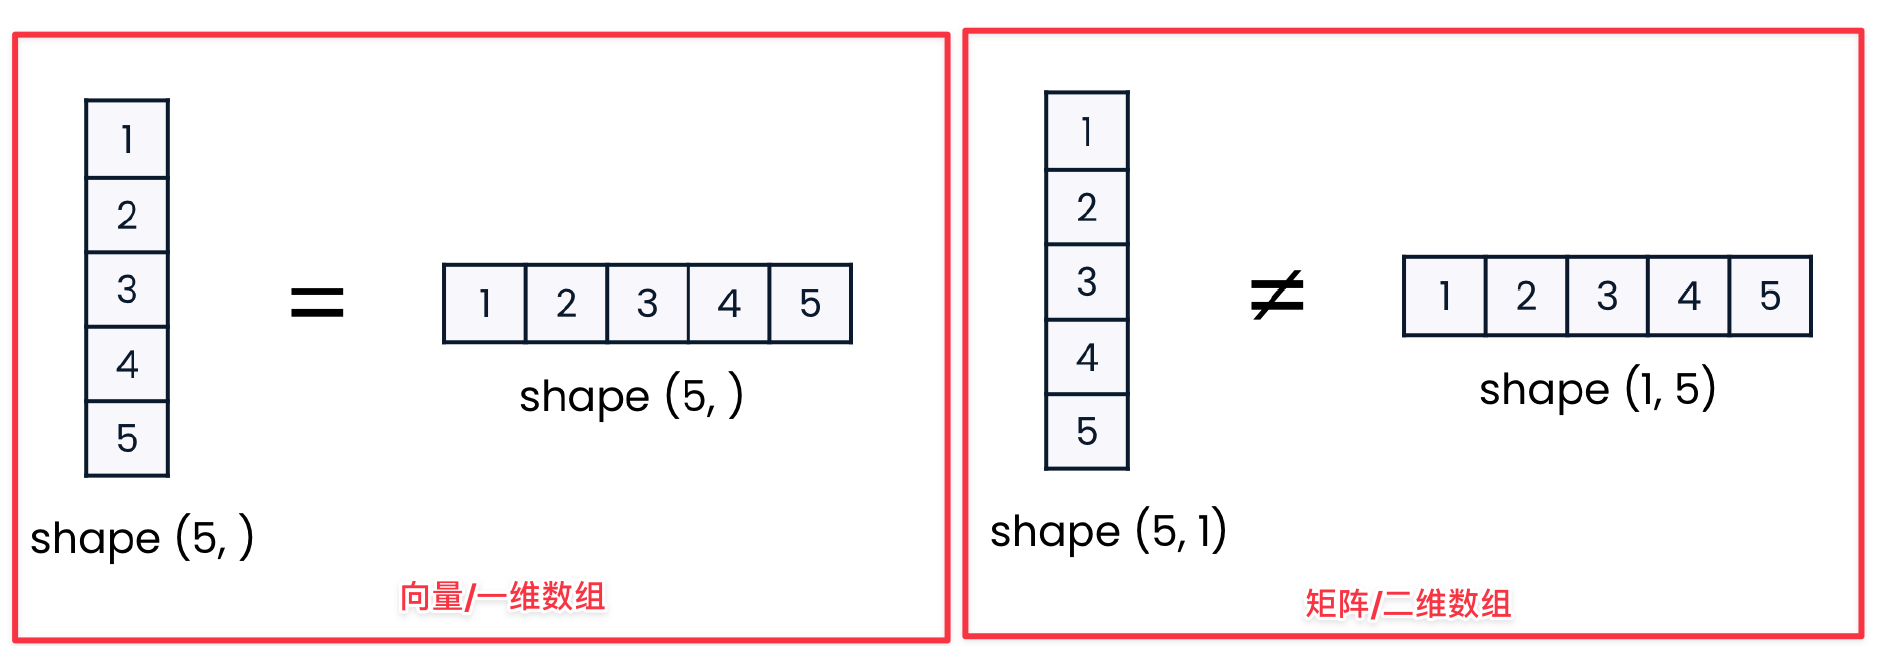
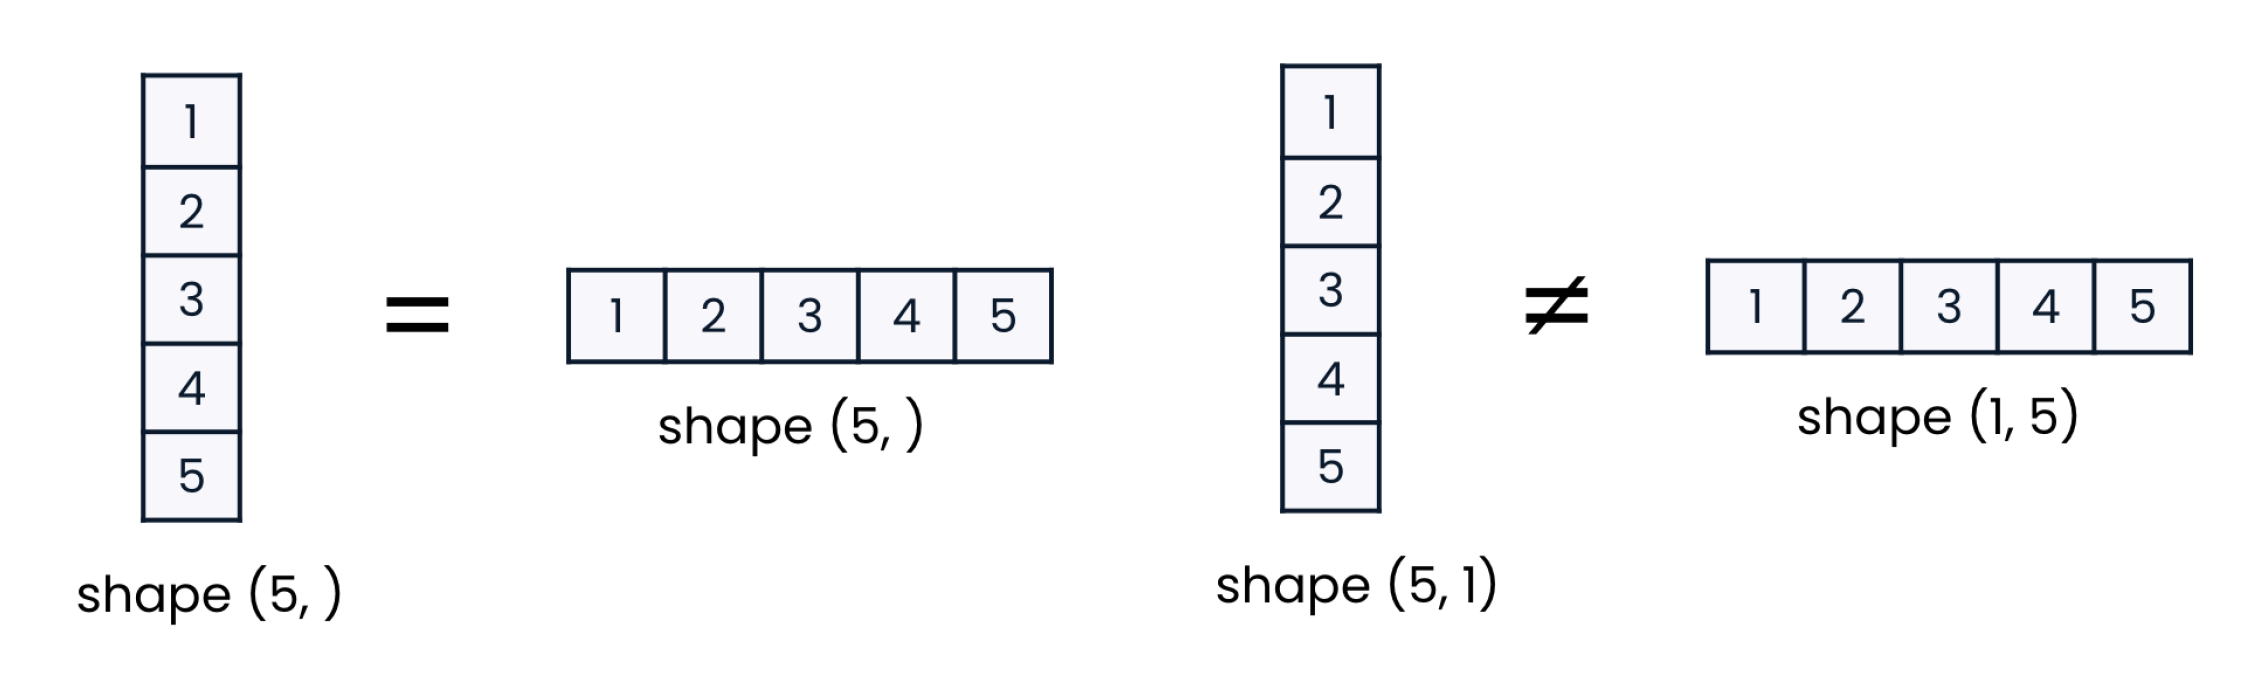
- 一维数组中
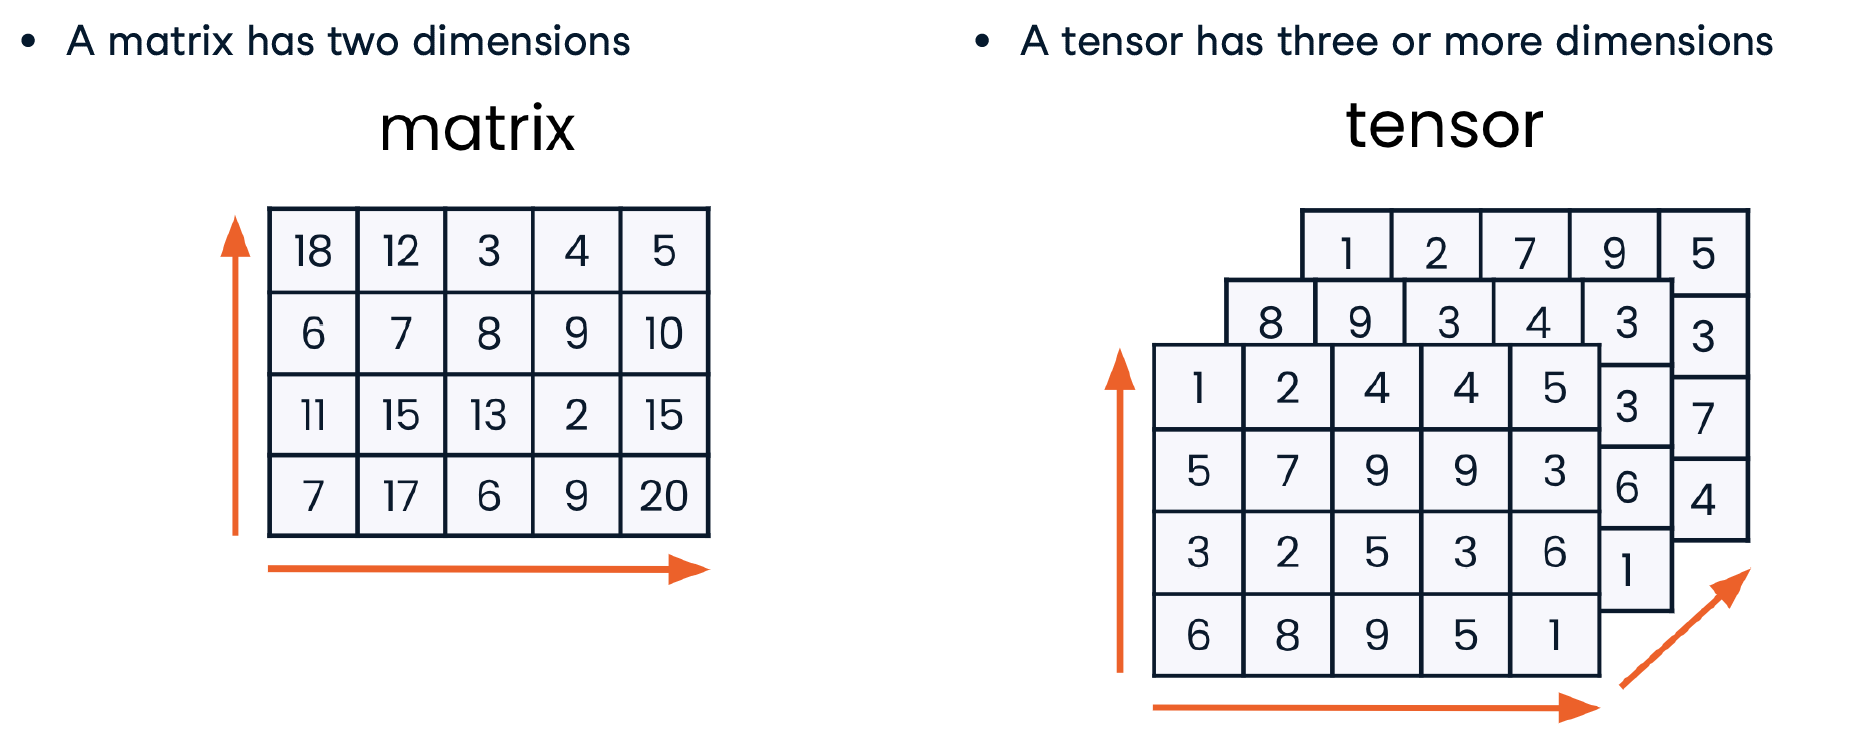
(5,)和(,5)是一样的,一位数组也叫做 向量 - 二维数组叫 矩阵
- 三维数组叫 张量
.shape 获取形状
array = np.zeros((3, 5))
print(array.shape)
# 表示 3行5列
(3, 5)
.flatten() 数组一维化
array = np.array([[1, 2], [5, 7], [6, 6]])
array.flatten()
array([1, 2, 5, 7, 6, 6])
.reshape() 重设形状
array = np.array([[1, 2], [5, 7], [6, 6]])
array.reshape((2, 3))
array([[1, 2, 5],
[7, 6, 6]])
向量转二维数组
通常,机器学习模型需要的 X 是二维数组。如果 X是向量,则我们需要将其转为 1列多行 的 二维数组。
X_bmi = X[:, 3]
print(y.shape, X_bmi.shape)
(752,) (752,)
X_bmi = X_bmi.reshape(-1, 1)
print(X_bmi.shape)
(752, 1)
.ndim 维度
获取array的维度
np.array type
data.dtype #获取数据类型
Sample NumPy data types:
- np.int64, np.int32, np.int16, np.int8
- np.float64
- np.float32
arr1 = np.array([1, 2, 3], dtype=np.float64)
arr2 = np.array([1, 2, 3], dtype=np.int32)

# data.astype()显式转换数据类型
float_arr1 = arr1.astype(np.float64)
float_arr2 = arr2.astype(arr1.dtype)
注意的是,一个np.array 只有一种数据类型,不一致将发生强制转换。
Indexing and slicing
- array[ indexArray ]
- array[ booleanArray ]
Indexing 1D arrays
array = np.array([2, 4, 6, 8, 10])
array[3]
8
Indexing elements in 2D
# 先行后列
sudoku_game[2, 4]

# 取第0行,从0开始数
sudoku_game[0]

# 取第4列,从0开始数
sudoku_game[:, 3]
Slicing 1D arrays
array = np.array([2, 4, 6, 8, 10])
array[2:4]
array([6, 8])
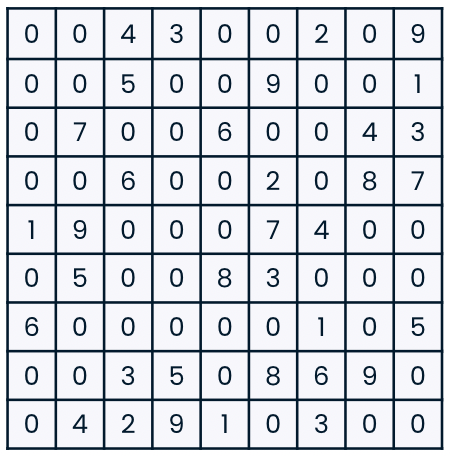
Slicing 2D arrays
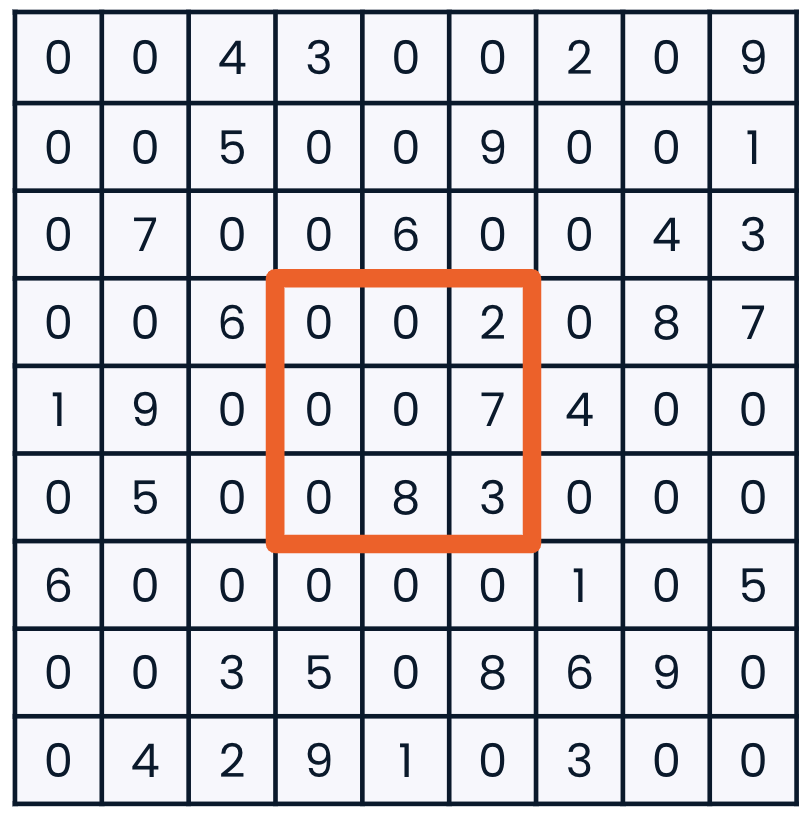
sudoku_game[3:6, 3:6]
array([[0, 0, 2],[0, 0, 7],[0, 8, 3]])
注意的是
- 截取第2列
[:,2] - 截取第2行
[2,]或者[2,:]
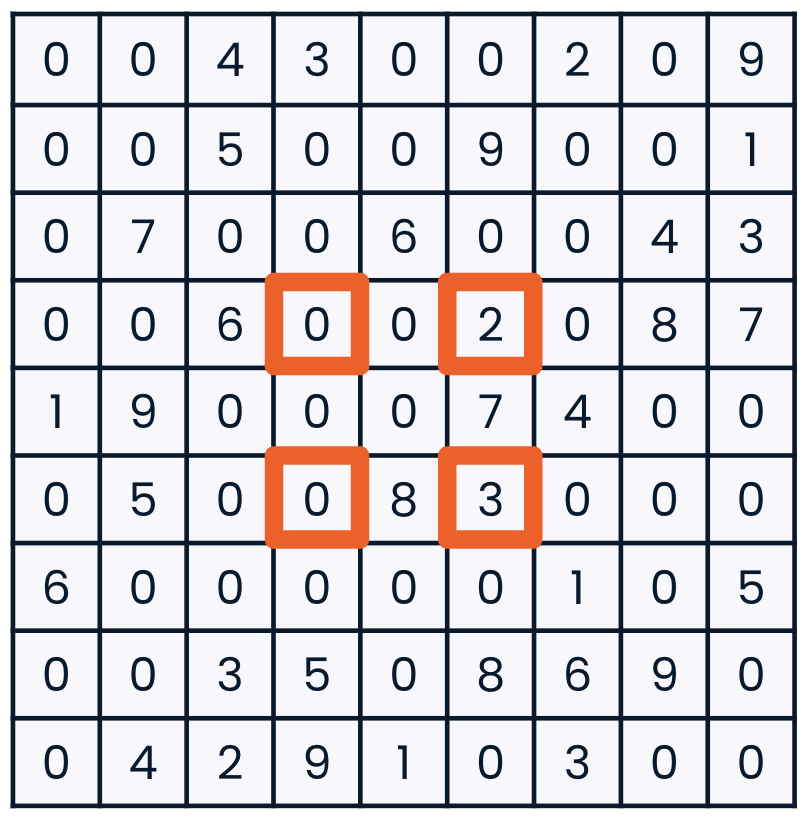
# 设置步长
sudoku_game[3:6:2, 3:6:2]
array([[0, 2],[0, 3]])
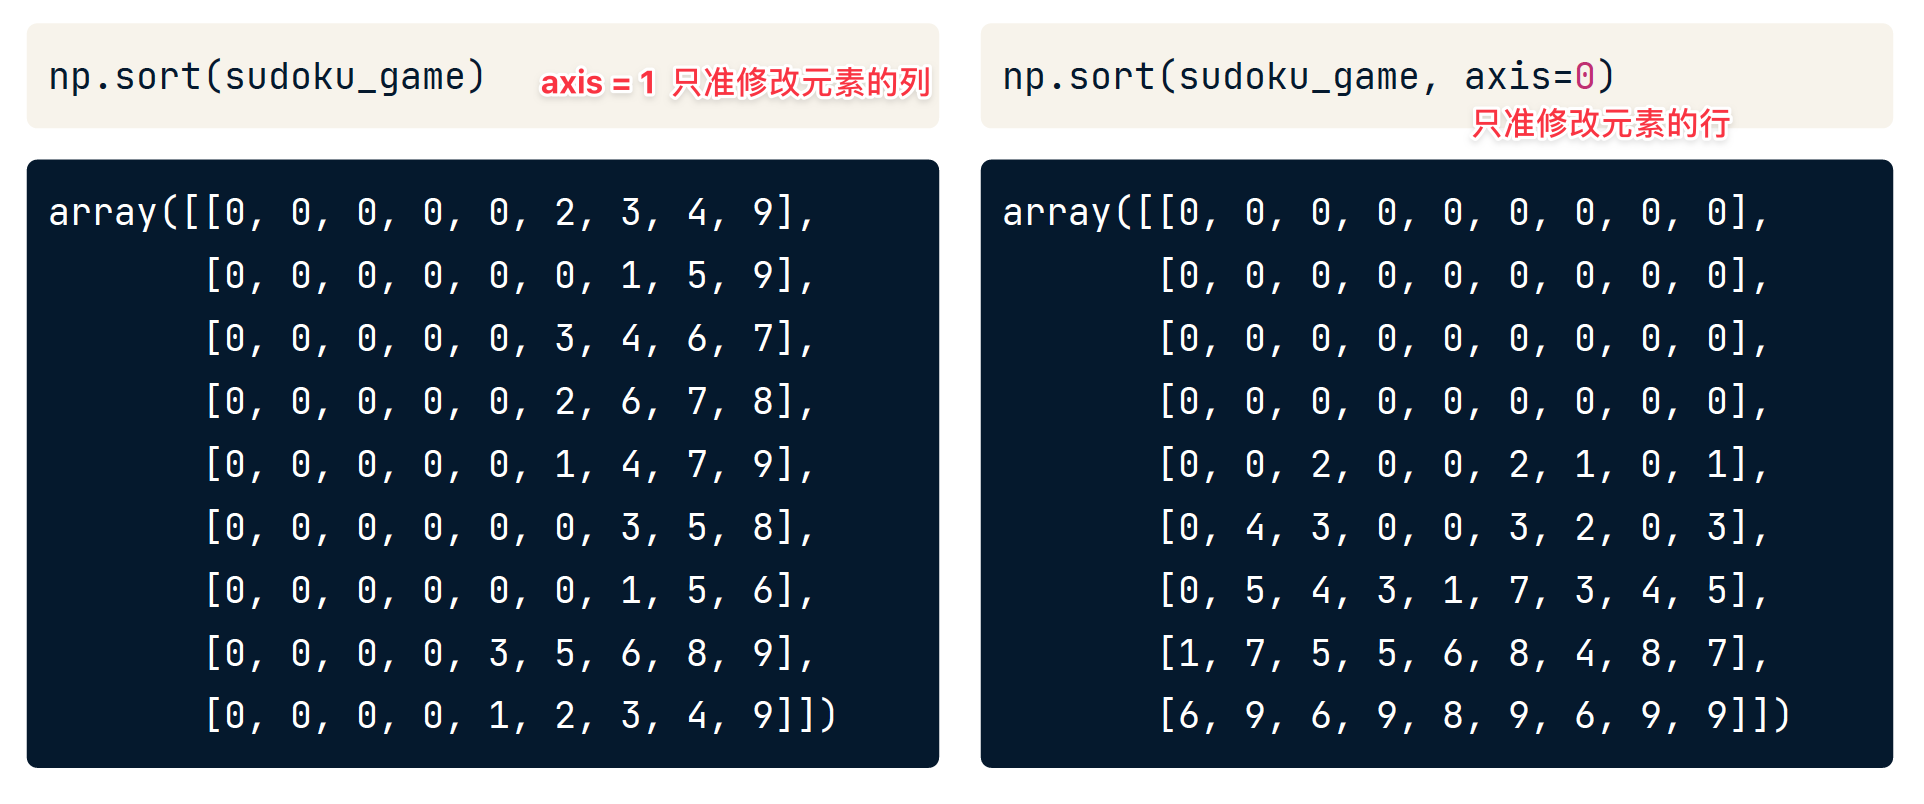
Axis
Sort
Boolean calculate
>> bmi = array([21.852, 20.975, 21.75 , 24.747, 21.441])
>> bmi > 21

output: array([True, False, True, True, True], dtype=bool)
Filter
Boolean masks
one_to_five = np.arange(1, 6)
mask = one_to_five % 2 == 0
mask
one_to_five[mask]
array([False, True, False, True, False])
array([2, 4])
# with 2d
# Create an array which contains row data on the largest tree in tree_census
largest_tree_data = tree_census[tree_census[:, 2] == 51]
print(largest_tree_data)

# Slice largest_tree_data to get only the block ID
largest_tree_block_id = largest_tree_data[:, 1]
print(largest_tree_block_id)

# Create an array which contains row data on all trees with largest_tree_block_id
trees_on_largest_tree_block = tree_census[tree_census[:, 1] == largest_tree_block_id]
print(trees_on_largest_tree_block)
<script.py> output:
    [[    61 501882     51      0]]
    [501882]
    [[    60 501882      8      0]
     [    61 501882     51      0]
     [    62 501882      7      0]
     [    63 501882      4      0]
     [    64 501882     15      0]
     [    65 501882      3      0]
     [    66 501882      8      0]
     [    67 501882      6      0]
     [    68 501882      6      0]
     [    69 501882      3      0]]
np.where()
返回符合条件的 index
# Create an array of row_indices for trees on block 313879
row_indices = np.where(tree_census[:,1] == 313879)
print(row_indices)

# Create an array which only contains data for trees on block 313879
block_313879 = tree_census[row_indices]
print(block_313879)
<script.py> output:
    (array([921, 922]),)
    [[  1115 313879      3      0]
     [  1116 313879     17      0]]
充当替换功能
# Create and print a 1D array of tree and stump diameters
# np.where(condition, x, y) 满足条件(condition),输出x,不满足输出y, 相当于 java里的三目表达式
trunk_stump_diameters = np.where(tree_census[:,2] == 0, tree_census[:,3], tree_census[:,2])
print(trunk_stump_diameters)
<script.py> output:
    [24 20  ...... 6]
Adding and removing
Concatenating

classroom_ids_and_sizes = np.array([[1, 22], [2, 21], [3, 27], [4, 26]])
new_classrooms = np.array([[5, 30], [5, 17]])
np.concatenate((classroom_ids_and_sizes, new_classrooms), axis = 0)
array([[ 1, 22],
[ 2, 21],
[ 3, 27],
[ 4, 26],
[ 5, 30],
[ 5, 17]])
classroom_ids_and_sizes = np.array([[1, 22], [2, 21], [3, 27], [4, 26]])
grade_levels_and_teachers = np.array([[1, "James"], [1, "George"], [3,"Amy"], [3, "Meehir"]])
np.concatenate((classroom_ids_and_sizes, grade_levels_and_teachers), axis=0)
array([['1', '22', '1', 'James'], ['2', '21', '1', 'George'], ['3', '27', '3', 'Amy'], ['4', '26', '3', 'Meehir']])
Deleting with np.delete()

delete 必须指定 axis,否则将会造成结果一维化。
Summarizing data
- np.median(series或np.array)
- np.mean(series或np.array)
- np.max(series或np.array)
- np.quantile
计算95% 置信空间
# Print the 95% confidence interval
print(np.quantile(cv_results, [0.025, 0.975]))
[0.74141863 0.77191915]
还可以
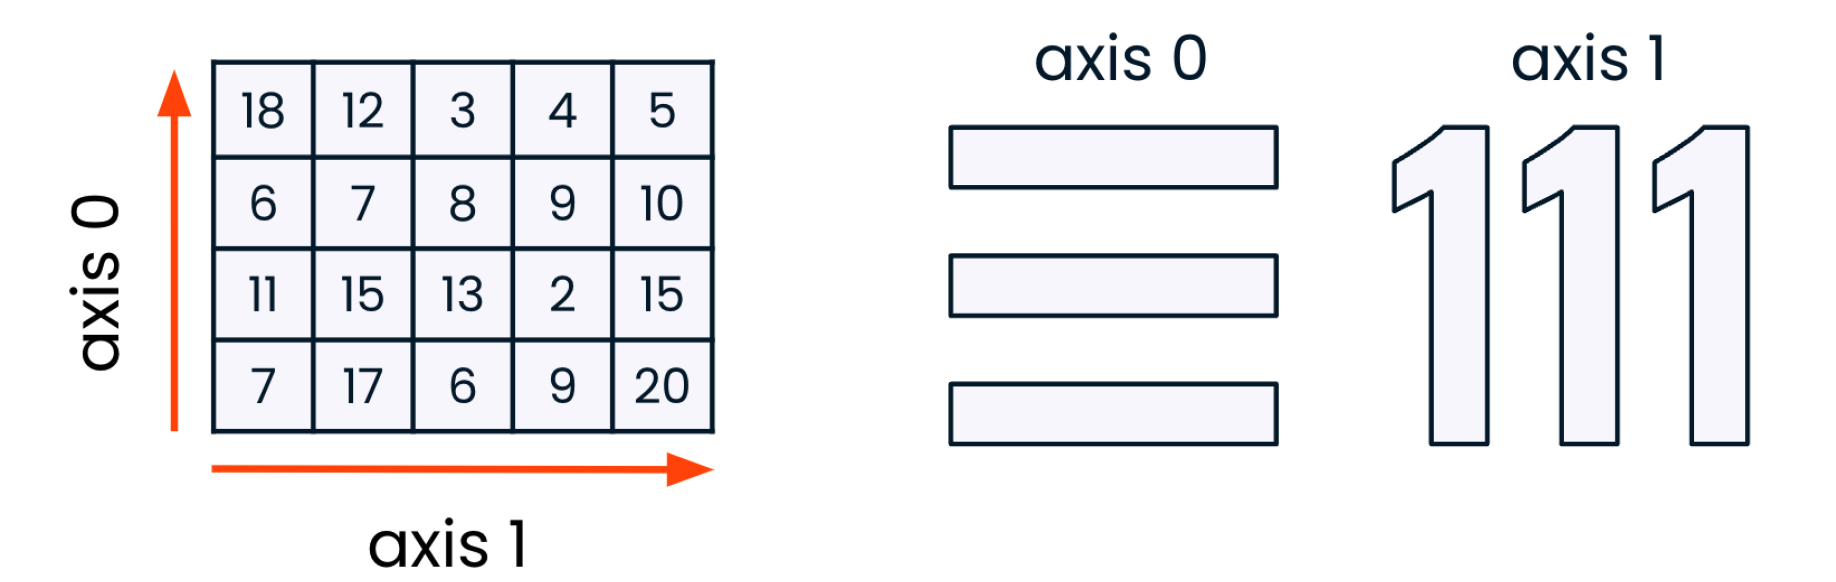
- .sum(axis = 0)
- .min() / .max()
- .cumsum()
keepdims = True
# Create a 2D array of total monthly sales across industries
monthly_industry_sales = monthly_sales.sum(axis=1, keepdims=True)
print(monthly_industry_sales)

# Add this column as the last column in monthly_sales
monthly_sales_with_total = np.concatenate((monthly_sales,monthly_industry_sales), axis = 1 )
print(monthly_sales_with_total)
<script.py> output:
    [[36716]
     [37133]
     ......
     [52830]]
    [[ 4134 23925  8657 36716]
     ......
     [ 6630 27797 18403 52830]]
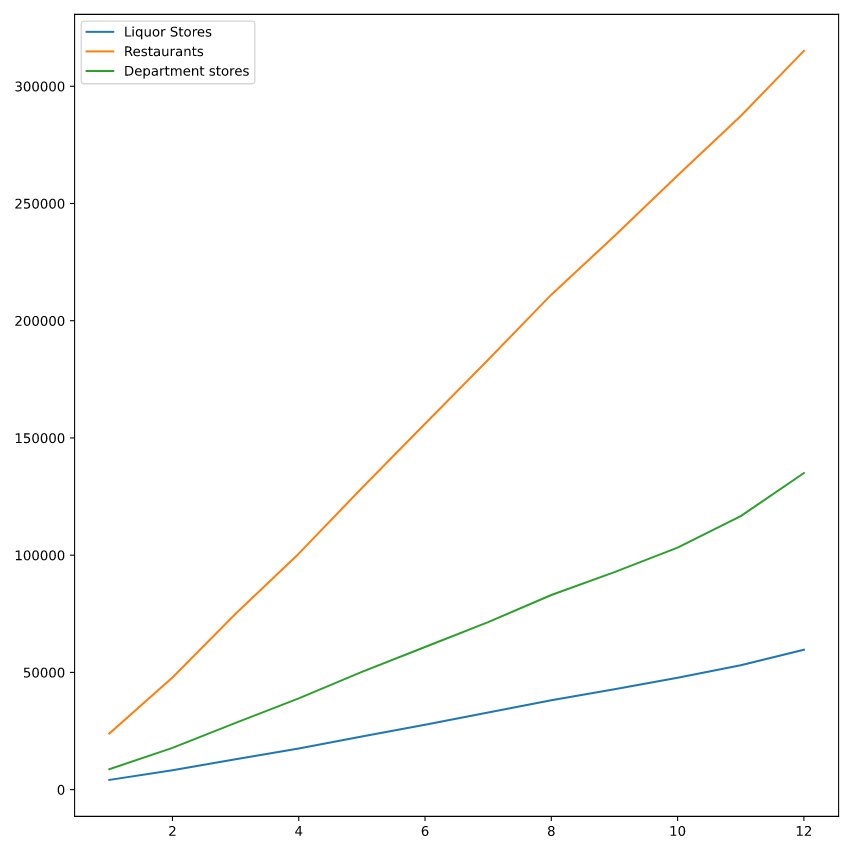
.cumsum()
# Find cumulative monthly sales for each industry
cumulative_monthly_industry_sales = monthly_sales.cumsum(axis=0)
print(cumulative_monthly_industry_sales)

# Plot each industry's cumulative sales by month as separate lines
plt.plot(np.arange(1, 13), cumulative_monthly_industry_sales[:,0], label="Liquor Stores")
plt.plot(np.arange(1, 13), cumulative_monthly_industry_sales[:,1], label="Restaurants")
plt.plot(np.arange(1, 13), cumulative_monthly_industry_sales[:,2], label="Department stores")
plt.legend()
plt.show()
<script.py> output:
    [[  4134  23925   8657]
		 ......
     [ 59673 315105 135026]]
Calculate
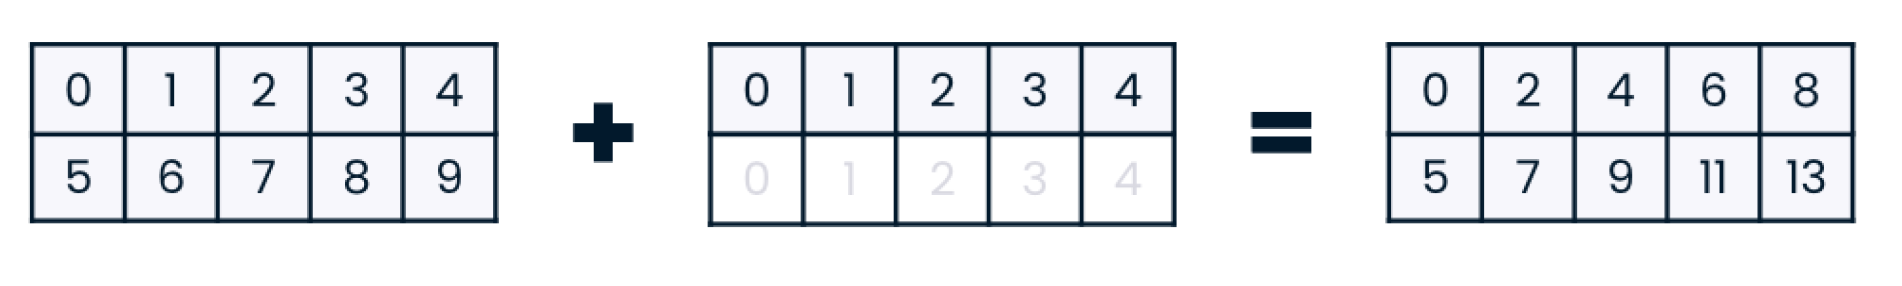
向量化计算
使得每个元素都得到计算
import numpy as np
np_height = np.array([1.73, 1.68, 1.71, 1.89, 1.79])
np_weight = np.array([65.4, 59.2, 63.6, 88.4, 68.7])
bmi = np_weight / np_height ** 2
for val in bmi :
print(val)

output:
  21.852
  20.975
  21.750
  24.747
  21.441
函数适用于元素
将Python的函数变成适用于np.array的元素的函数
array = np.array(["NumPy", "is", "awesome"])
len(array) > 2
True
变换后
vectorized_len = np.vectorize(len)
vectorized_len(array) > 2
array([ True, False, True])
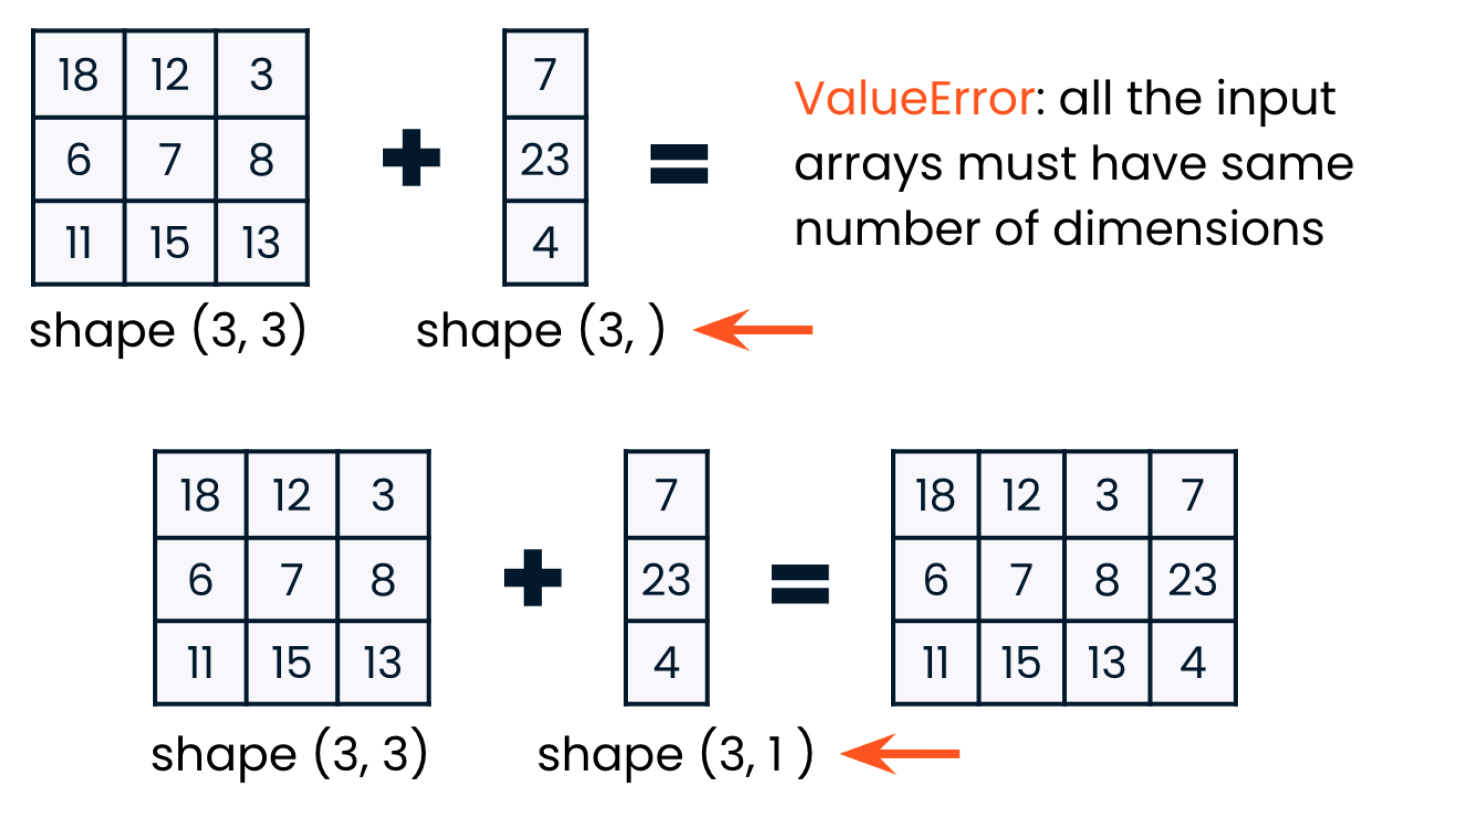
Broadcastable
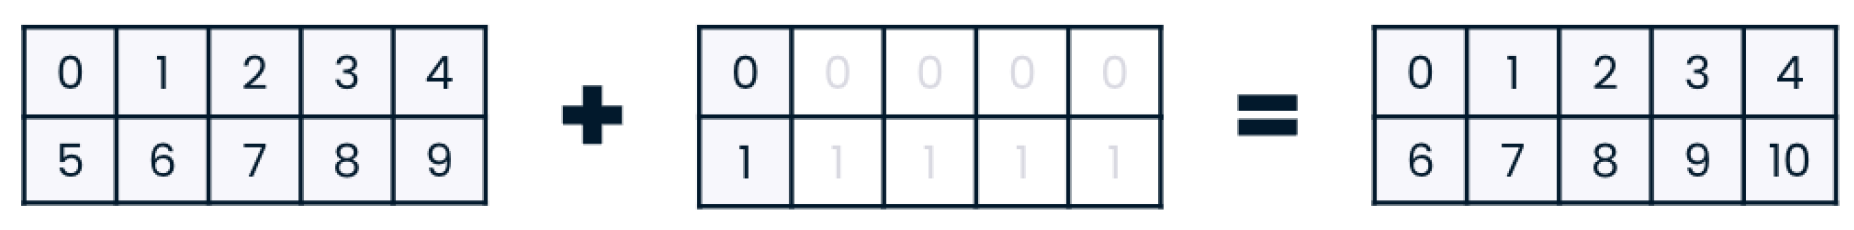
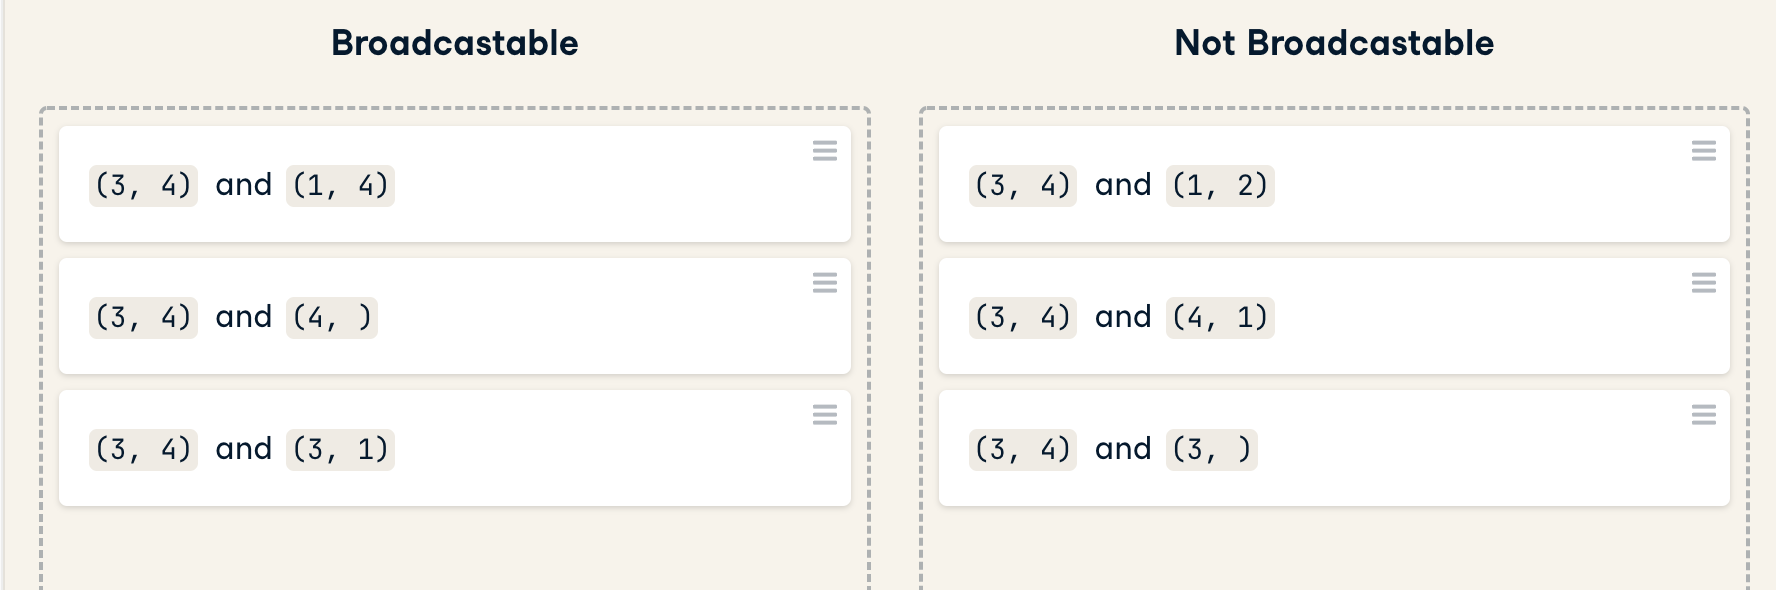
一维数组尽管是一维,处理时应看做时1行而不是1列。
不可广播的应当尝试调整形状
Number generators
np.linspace()
# 从0-20以平均分布取样,递增的,首位0 末位20,取样25个
print(np.linspace(0,20))
[ 0.          0.40816327  0.81632653  1.2244898   1.63265306  2.04081633
  2.44897959  2.85714286  3.26530612  3.67346939  4.08163265  4.48979592
  4.89795918  5.30612245  5.71428571  6.12244898  6.53061224  6.93877551
  7.34693878  7.75510204  8.16326531  8.57142857  8.97959184  9.3877551
  9.79591837 10.20408163 10.6122449  11.02040816 11.42857143 11.83673469
 12.24489796 12.65306122 13.06122449 13.46938776 13.87755102 14.28571429
 14.69387755 15.10204082 15.51020408 15.91836735 16.32653061 16.73469388
 17.14285714 17.55102041 17.95918367 18.36734694 18.7755102  19.18367347
 19.59183673 20.        ]
# 从0-20以平均分布取样,递增的,首位1 末位20,取样20个
print(np.linspace(1,20,20))
[ 1. 2. 3. 4. 5. 6. 7. 8. 9. 10. 11. 12. 13. 14. 15. 16. 17. 18. 19. 20.]
np.arange()
explanatory_data = pd.DataFrame({"length_cm": np.arange(20, 41)})
	length_cm
0 20
1 21
2 22
...
20 40
...
Random generators
import numpy as np

np.random.seed(123) # Starting from a seed
np.random.rand() # Pseudo-random numbers

coin = np.random.randint(0,2) # Randomly generate 0 or 1
jitter = np.random.normal(0, 2, size=len(brfss)) # 以正态分布(mean = 0, sd = 2)产生随机数series
Read file
Much of the time you will need to import datasets which have different datatypes in different columns; one column may contain strings and another floats, for example. The function np.loadtxt() will freak at this.
There is also another function np.recfromcsv() that behaves similarly to np.genfromtxt(), except that its default dtype is None. In this exercise, you'll practice using this to achieve the same result.
data = np.loadtxt(file, delimiter='\t', dtype=str)
data_float = np.loadtxt(file, delimiter="\t", dtype=float, skiprows=1)

data = np.genfromtxt('titanic.csv', delimiter=',', names=True, dtype=None)
d = np.recfromcsv(file)
或者都使用 with open 打开
with open("logo.npy", "rb") as f:
	logo_rgb_array = np.load(f)
Save arrays in many formats:
- .csv
- .txt
- .pkl
- .npy
RGB arrays
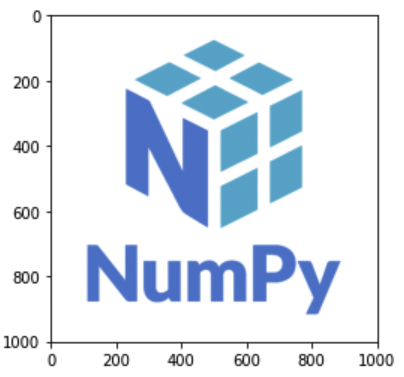
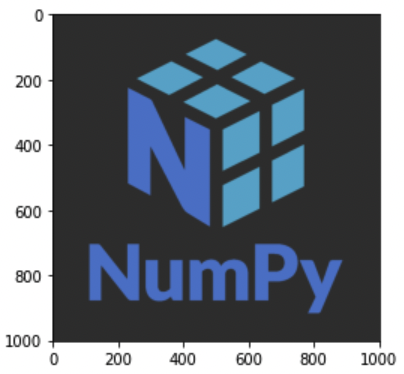
Loading .npy files
with open("logo.npy", "rb") as f:
  logo_rgb_array = np.load(f)
  plt.imshow(logo_rgb_array)
  plt.show()
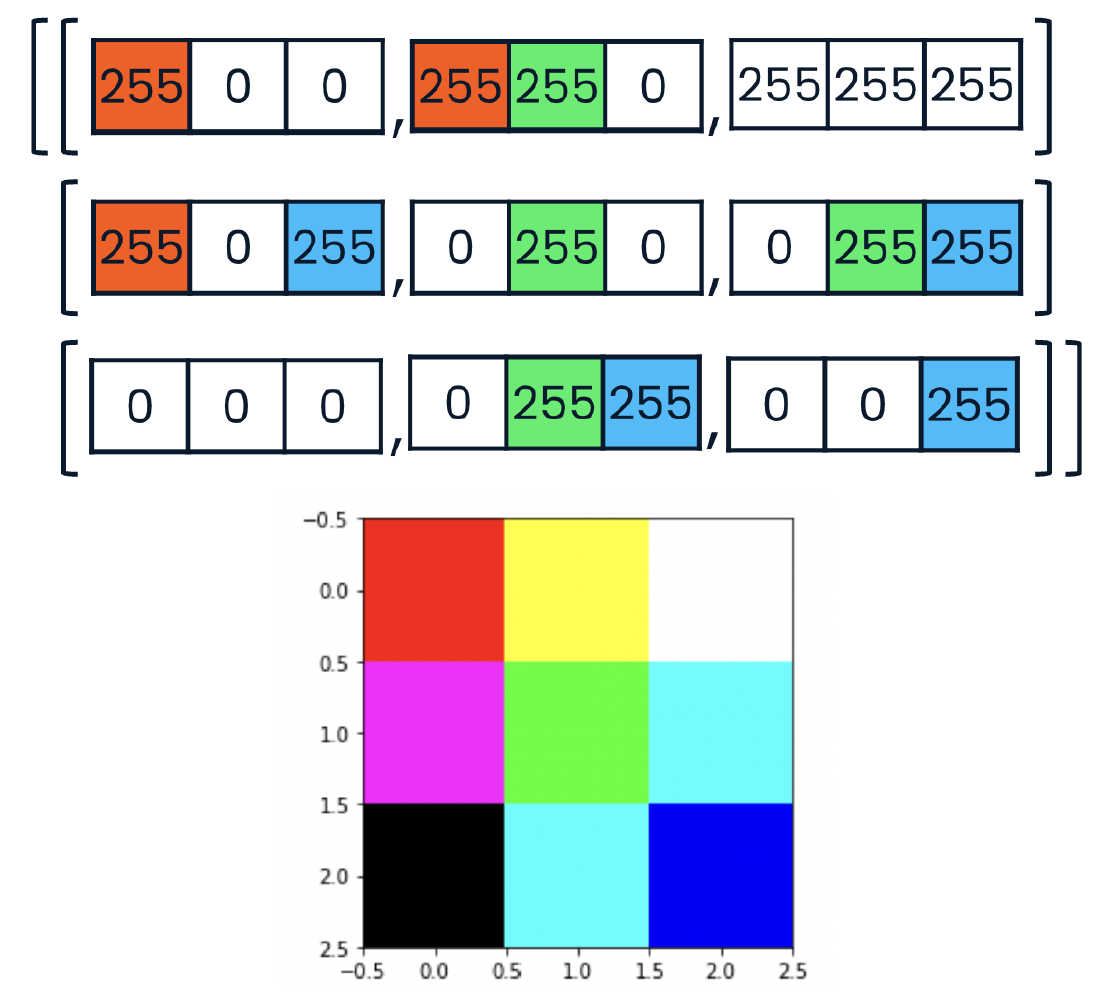
Examining RGB data
- RGB图片是一个三维数组
- x = 图片长度
- y = 图片宽度
- z = 3, 存放RGB三个值
- RGB越大颜色越大
- [255,255,255] 表示纯白
- [0,0,0] 表示纯无/纯黑/纯透明
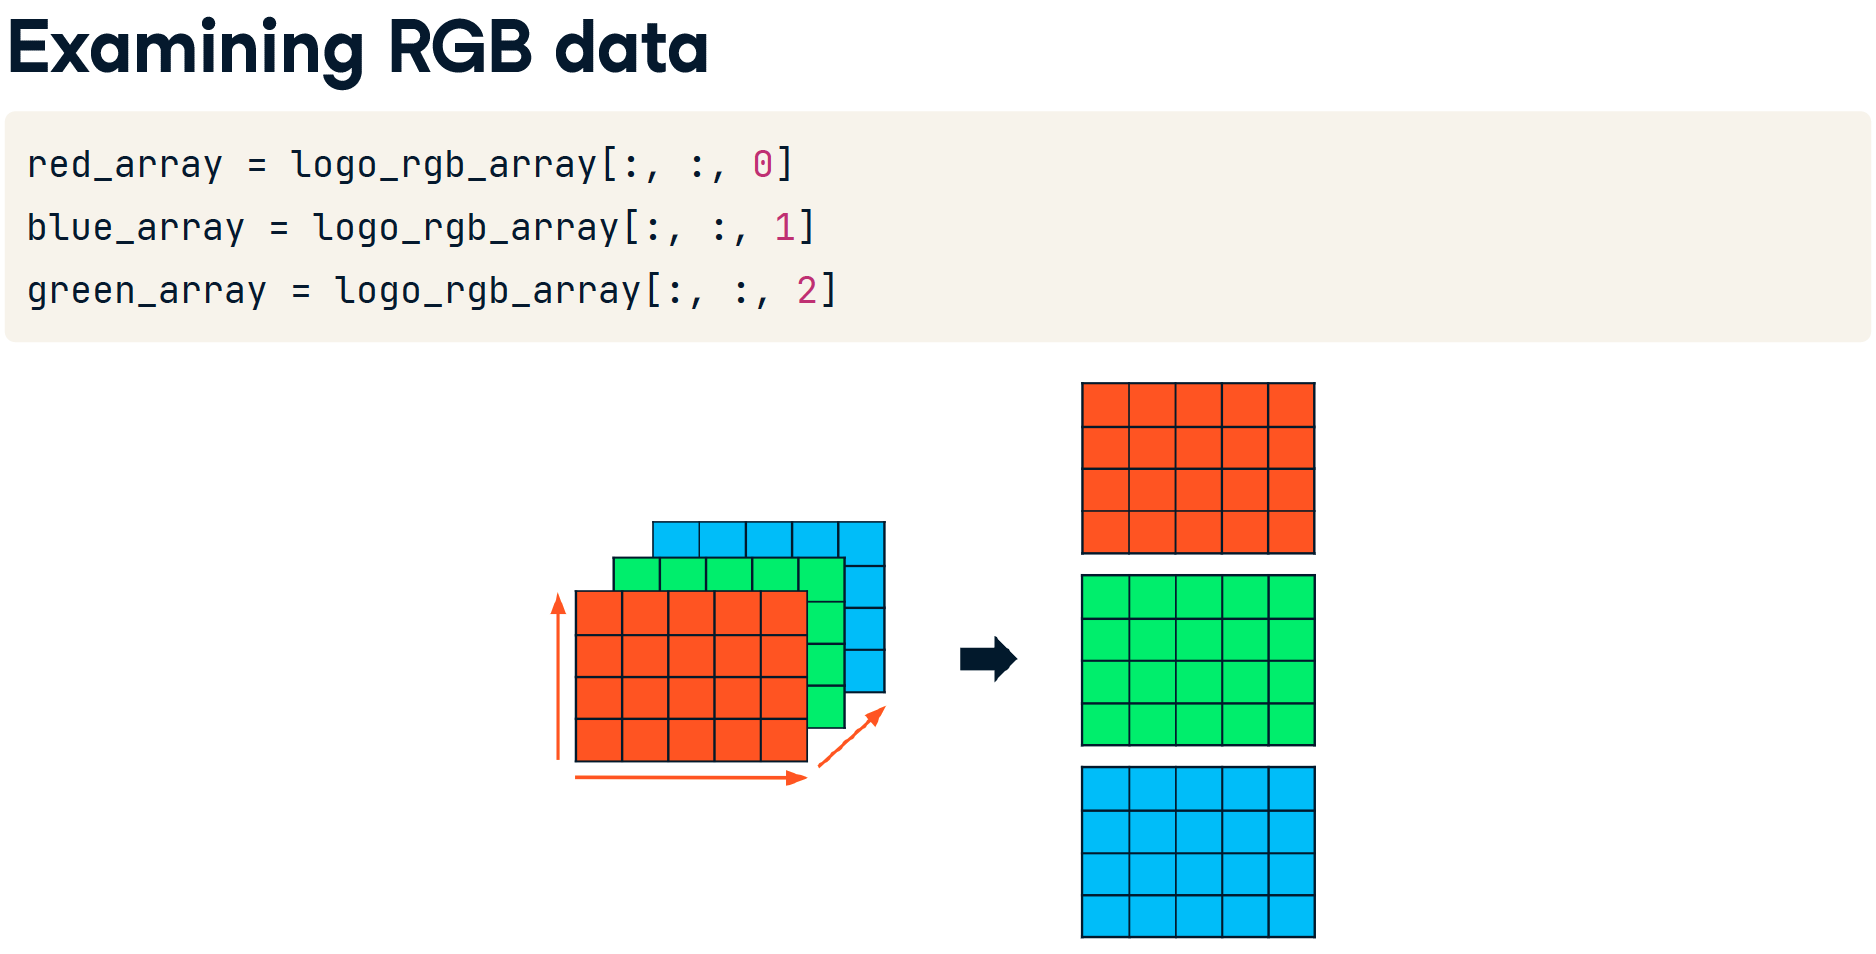
red_array[1], green_array[1], blue_array[1]
(array([255, 255, 255, ..., 255, 255, 255]),
array([255, 255, 255, ..., 255, 255, 255]),
array([255, 255, 255, ..., 255, 255, 255]))
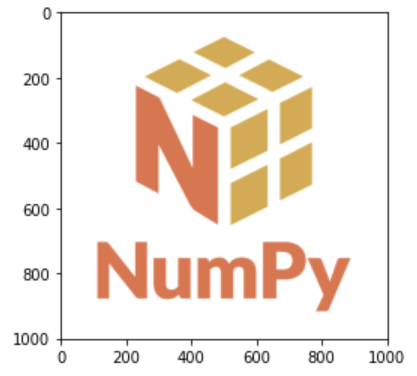
Updating RGB data
案例1
dark_logo_array = np.where(logo_rgb_array == 255, 50, logo_rgb_array)
plt.imshow(dark_logo_array)
plt.show()
案例2
# Reduce every value in rgb_array by 50 percent
darker_rgb_array = rgb_array * 0.5

# Convert darker_rgb_array into an array of integers
darker_rgb_int_array = darker_rgb_array.astype(int)
plt.imshow(darker_rgb_int_array)
plt.show()

Saving arrays as .npy files
with open("dark_logo.npy", "wb") as f:
	np.save(f, dark_logo_array)
Array acrobatics
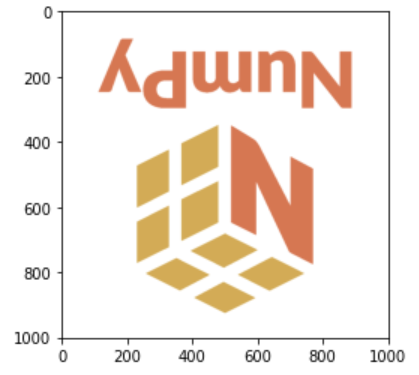
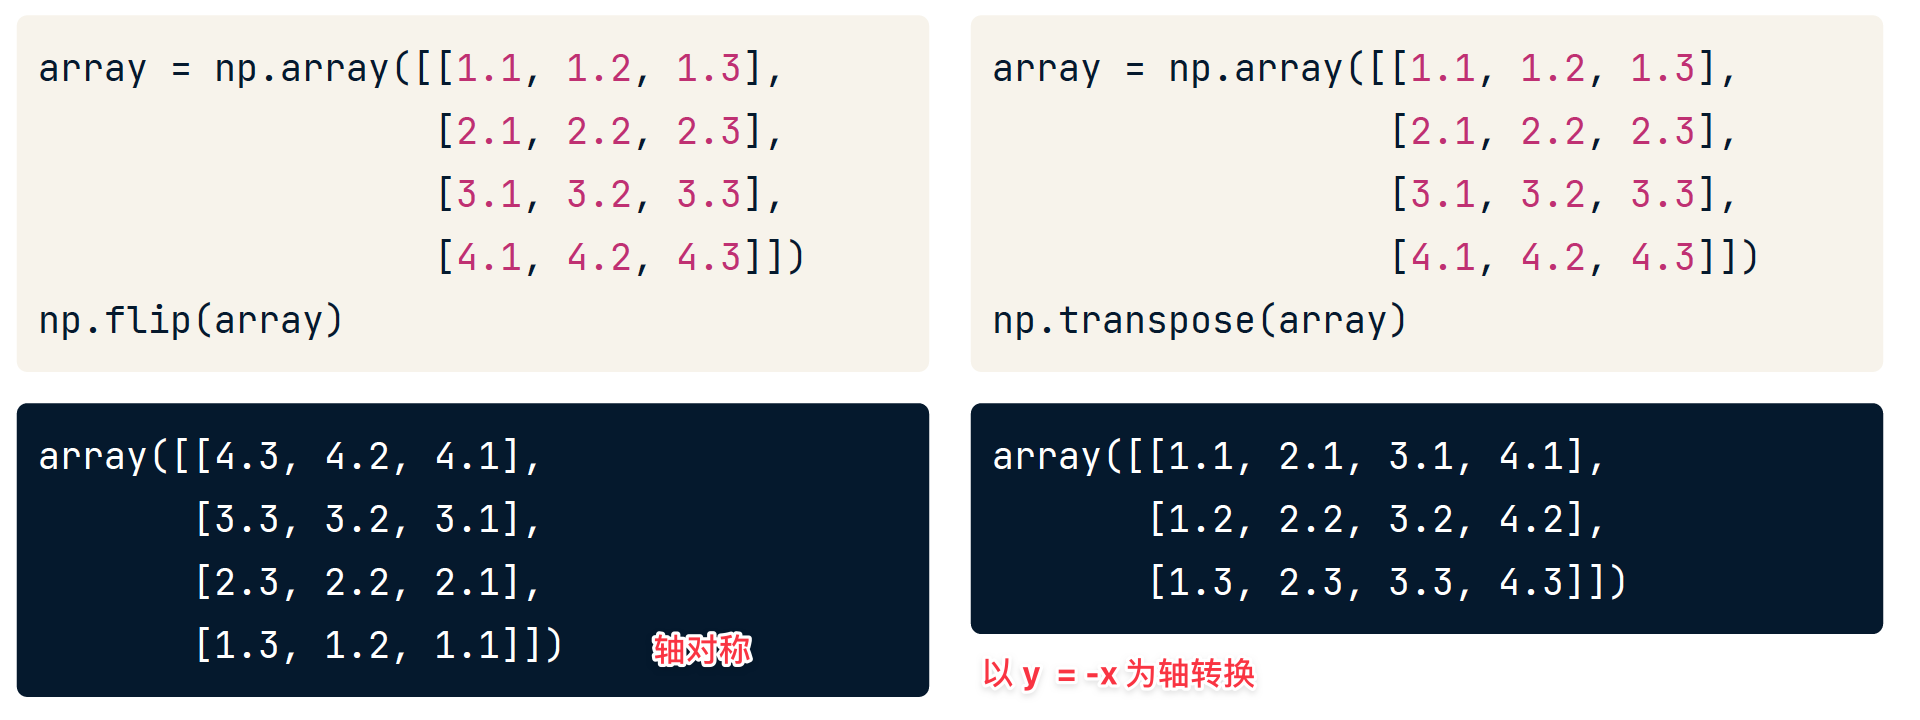
Flipping an array
- 可指定axis,表示在哪一个维度上进行对称交换
- 不指定axis 则所有轴都转换,相当于中心对称
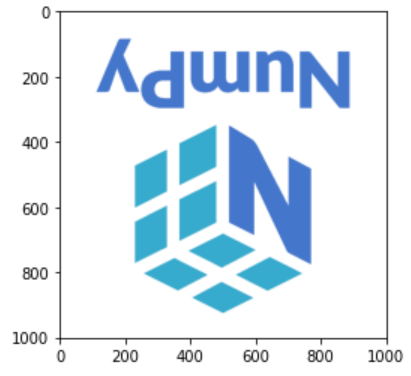
flipped_logo = np.flip(logo_rgb_array)
plt.imshow(flipped_logo)
plt.show()
flipped_rows_logo = np.flip(logo_rgb_array, axis=0)
plt.imshow(flipped_rows_logo)
plt.show()

flipped_colors_logo = np.flip(logo_rgb_array, axis=2)
plt.imshow(flipped_colors_logo)
plt.show()
flipped_except_colors_logo = np.flip(logo_rgb_array, axis=(0, 1))
plt.imshow(flipped_except_colors_logo)
plt.show()
Transposing an array
transposed_logo = np.transpose(logo_rgb_array, axes=(1, 0, 2))
plt.imshow(transposed_logo)
plt.show()

help()
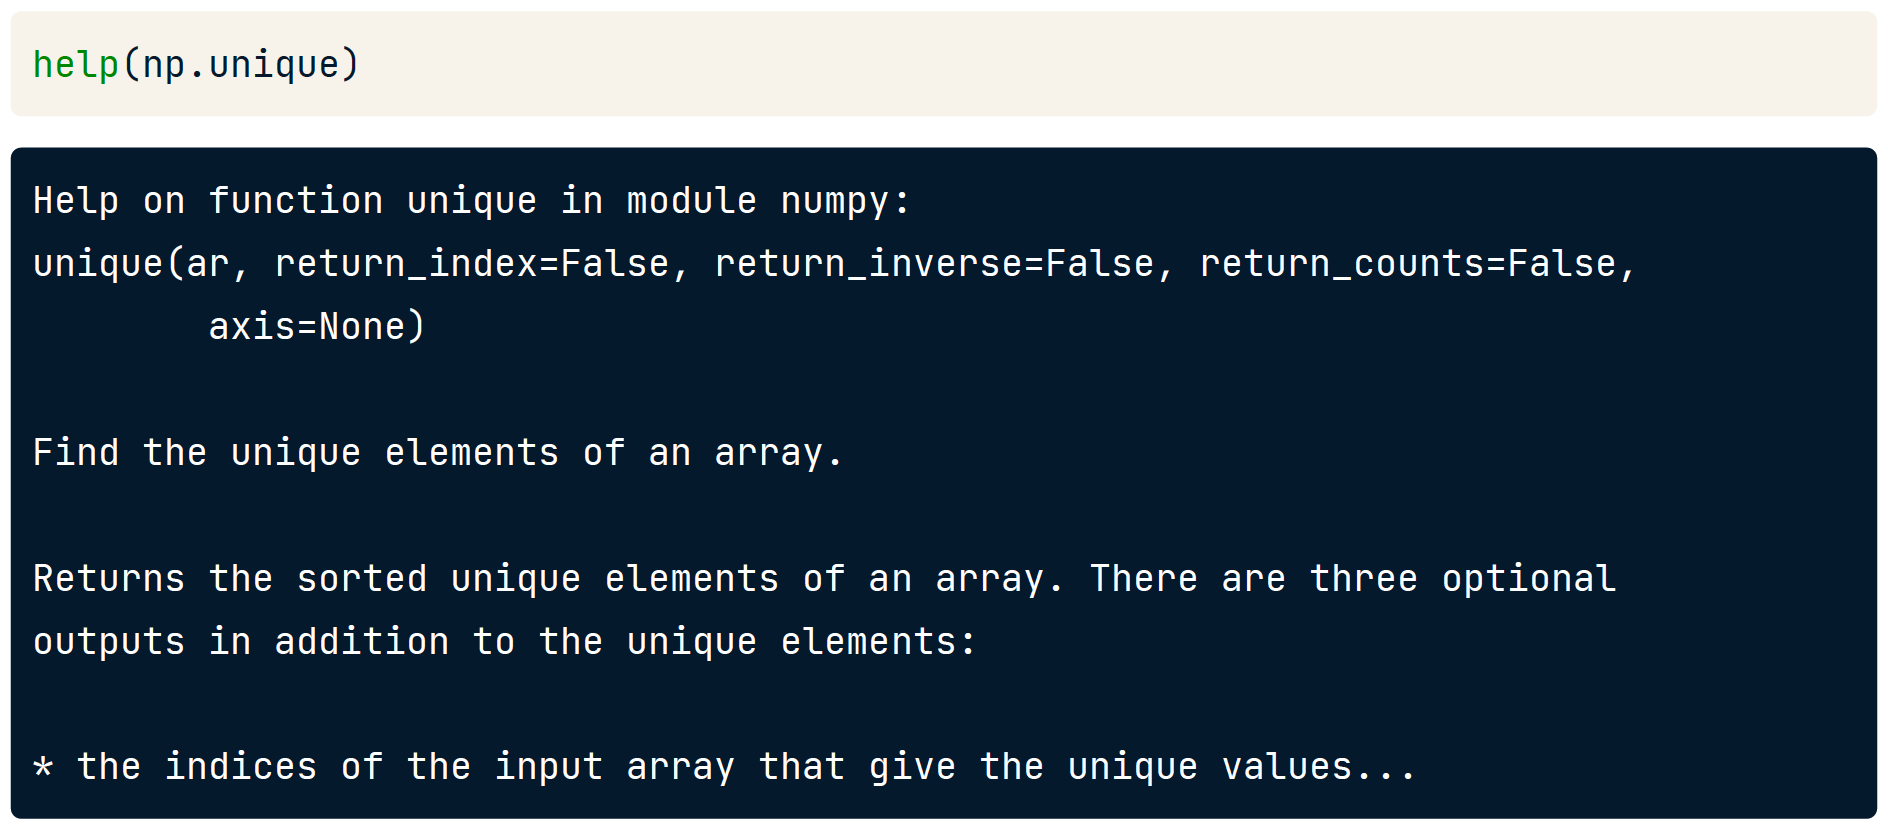
# Display the documentation for .astype()
help(np.ndarray.astype)
Stacking and splitting
理解多维数组应当以建筑中的横梁来看看待数据。
Slicing dimensions
请见 [Examining RGB data](#Examining RGB data)
Splitting arrays
# 拆包
red_array, green_array, blue_array = np.split(rgb, 3, axis=2)
red_array
red_array.shape
array([ [[255], [255], [255]],  [[255], [ 0], [ 0]],  [[255], [ 0], [ 0]]])
(3, 3, 1)
当我们分割一个数组时,产生的数组的维数与原数组相同,因为含义由z条状数据变成y条状数据,因此需要 Trailing dimensions。
red_array_2D = red_array.reshape((3, 3))
red_array_2D
red_array_2D.shape
array([[255, 255, 255], [255, 0, 0], [ 0, 0, 0]])
(3, 3)
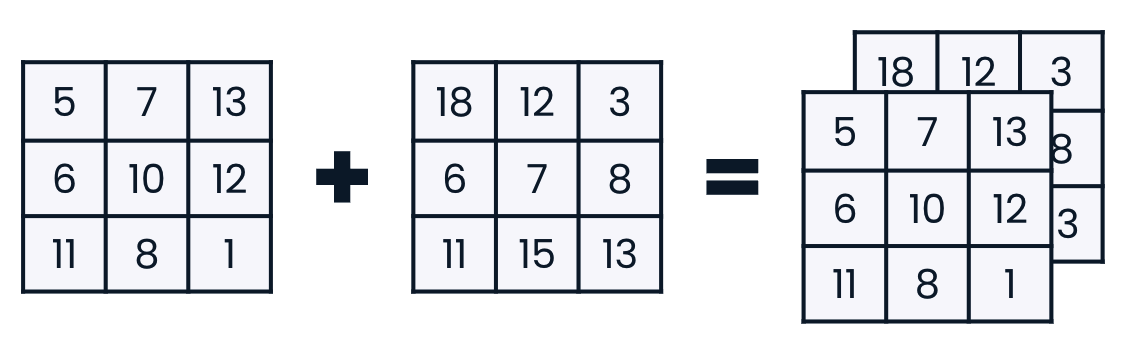
Stacking arrays
red_array = np.zeros((1001, 1001)).astype(np.int32)
green_array = green_array.reshape((1001, 1001))
blue_array = blue_array.reshape((1001, 1001))

stacked_rgb = np.stack([red_array, green_array, blue_array], axis=2)
plt.imshow(stacked_rgb)
plt.show()
查看另一个案例
- 上方的案例,每一个z轴是一个数据组,因此axis = 2
- 下面的案例,每一个y轴是一个数据组,因此axis = 1
- 记住怎么拆的就怎么合
monthly_sales的第一个维度是三个行业的单月销售额的行,第二个维度是单个行业的月度销售数据的列。你的任务是将这些数据分割成季度销售数据,并将季度销售数据堆叠起来,使新的第三维代表季度销售的四个二维数组。
# Split monthly_sales into quarterly data
q1_sales, q2_sales, q3_sales, q4_sales = np.split(monthly_sales, 4)

# Print q1_sales
print(q1_sales)

# Stack the four quarterly sales arrays
quarterly_sales = np.stack([q1_sales, q2_sales, q3_sales, q4_sales], axis = 0)
print(quarterly_sales)
查看莫奈的画 蓝色加深案例
也许你想更好地理解莫奈对蓝色的使用。你的任务是创建一个莫奈rgb_array的版本,通过使它们变得更蓝来强调画中使用大量蓝色的部分你将在这个练习中执行这个任务的分割部分,在下一个练习中执行堆叠部分。
# Split rgb_array into red, green, and blue arrays
red_array, green_array, blue_array = np.split(rgb_array, 3, axis=2)

# Create emphasized_blue_array
emphasized_blue_array = np.where(blue_array > blue_array.mean(), 255, blue_array)

# Print the shape of emphasized_blue_array
print(emphasized_blue_array.shape)

# Remove the trailing dimension from emphasized_blue_array
emphasized_blue_array_2D = emphasized_blue_array.reshape(675,844)

# Print the shapes of blue_array and emphasized_blue_array_2D
print(blue_array.shape, emphasized_blue_array_2D.shape)

# Reshape red_array and green_array
red_array_2D = red_array.reshape((675, 844))
green_array_2D = green_array.reshape((675, 844))

# Stack red_array_2D, green_array_2D, and emphasized_blue_array_2D
emphasized_blue_monet = np.stack([red_array_2D, green_array_2D, emphasized_blue_array_2D], axis = 2)
plt.imshow(emphasized_blue_monet)
plt.show()