Import Data
Import Data
导入文件
Flat file
battledeath.xlsx is not a flat because it is a spreadsheet consisting of many sheets, not a single table.
DB is not a file
Pickled file
There are a number of datatypes that cannot be saved easily to flat files, such as lists and dictionaries. If you want your files to be human readable, you may want to save them as text files in a clever manner. JSONs, which you will see in a later chapter, are appropriate for Python dictionaries.
However, if you merely want to be able to import them into Python, you can serialize them. All this means is converting the object into a sequence of bytes, or a bytestream.
In this exercise, you'll import the pickle package, open a previously pickled data structure from a file and load it.
# Import pickle package
import pickle

# Open pickle file and load data: d
with open('data.pkl', "rb") as file:
    d = pickle.load(file)

# Print d
print(d)

# Print datatype of d
print(type(d))
csv
movies = pd.read_csv('tmdb_movies.csv', index_col=['id'])
medals = pd.read_csv('medals_by_country_2016.csv', index_col=0)
data = pd.read_csv(file, nrows = 5, header = None) #读前5行,原文件中没有column name
data = pd.read_csv(file, sep="\t", comment="#", na_values='Nothing') # 设定分隔符号,注释,na时的填入值
xlsx
# Import pandas
import pandas as pd

# Assign spreadsheet filename: file
file ='battledeath.xlsx'

# Load spreadsheet: xls
xls = pd.ExcelFile(file)

# Print sheet names
print(xls.sheet_names)

# Load a sheet into a DataFrame by name: df1
df1 = xls.parse('2004')

# Print the head of the DataFrame df1
print(df1.head())

# Load a sheet into a DataFrame by index: df2
df2 = xls.parse(0)

# Print the head of the DataFrame df2
print(df2.head())

"""
Parse the first sheet by index. In doing so, skip the first row of data and name the columns 'Country' and 'AAM due to War (2002)' using the argument names. The values passed to skiprows and names all need to be of type list.
"""

# Parse the first sheet and rename the columns: df1
df1 = xls.parse(0, skiprows=1, names=['Country','AAM due to War (2002)'])

# Print the head of the DataFrame df1
print(df1.head())

"""
Parse the second sheet by index. In doing so, parse only the first column with the usecols parameter, skip the first row and rename the column 'Country'. The argument passed to usecols also needs to be of type list.
"""

# Parse the first column of the second sheet and rename the column: df2
df2 = xls.parse(1, usecols=0, skiprows=1, names=['Country'])

# Print the head of the DataFrame df2
print(df2.head())
xls
# Import package
import pandas as pd

# Read in all sheets of Excel file: xls
xls = pd.read_excel(url,sheet_name = None) # 如果要读取所有sheet,必须指定sheet_name = null

# Print the sheetnames to the shell
print(xls.keys())

# Print the head of the first sheet (using its name, NOT its index)
print(xls["1700"].head()
sas7bdat
# Import sas7bdat package
from sas7bdat import SAS7BDAT

# Save file to a DataFrame: df_sas
with SAS7BDAT('sales.sas7bdat') as file:
    df_sas = file.to_data_frame()

# Print head of DataFrame
print(df_sas.head())


# Plot histogram of DataFrame features (pandas and pyplot already imported)
pd.DataFrame.hist(df_sas[['P']])
plt.ylabel('count')
plt.show()
dta
df = pd.read_stata('disarea.dta')
HDF5
# Import packages
import numpy as np
import h5py

# Assign filename: file
file = "LIGO_data.hdf5"

# Load file: data
data = h5py.File(file, 'r')

# Print the datatype of the loaded file
print(type(data))

# Print the keys of the file
for key in data.keys():
    print(key)

output:
<script.py> output:
    <class 'h5py._hl.files.File'>
    meta
    quality
    strain
# Get the HDF5 group: group
group = data['strain']

# Check out keys of group
for key in group.keys():
    print(key)

# Set variable equal to time series data: strain
strain = data['strain']['Strain'].value

# Set number of time points to sample: num_samples
num_samples = 10000

# Set time vector
time = np.arange(0, 1, 1/num_samples)

# Plot data
plt.plot(time, strain[:num_samples])
plt.xlabel('GPS Time (s)')
plt.ylabel('strain')
plt.show()
matlab
# Import package
import scipy.io

# Load MATLAB file: mat
filename = 'albeck_gene_expression.mat'
mat = scipy.io.loadmat(filename)

# Print the datatype type of mat
print(type(mat))

# Print the keys of the MATLAB dictionary
print(mat.keys())

# Print the type of the value corresponding to the key 'CYratioCyt'
print(type(mat['CYratioCyt']))

# Print the shape of the value corresponding to the key 'CYratioCyt'
print(np.shape(mat['CYratioCyt']))

# Subset the array and plot it
data = mat['CYratioCyt'][25, 5:]
fig = plt.figure()
plt.plot(data)
plt.xlabel('time (min.)')
plt.ylabel('normalized fluorescence (measure of expression)')
plt.show()
With sql
Workflow of SQL querying
- Import packages and functions
- Create the database engine
- Connect to the engine
- Query the database
- Save query results to a DataFrame
- Close the connection
使用 SQLAlchemy
以SQLAlchemy链接Sqlite为例
SQLAlchemy 支持 sqlite,mysql,PostgreSQL
from sqlalchemy import create_engine
import pandas as pd

engine = create_engine('sqlite:///Northwind.sqlite')
con = engine.connect()

rs = con.execute("SELECT * FROM Orders")

df = pd.DataFrame(rs.fetchall())
# Set the DataFrame's column names
df.columns = rs.keys() #指定column name

con.close()
使用with实现自动关闭
# Open engine in context manager
# Perform query and save results to DataFrame: df
with engine.connect() as con:
    rs = con.execute("SELECT LastName,Title FROM Employee")
    df = pd.DataFrame(rs.fetchmany(size = 3))
    df.columns = rs.keys()

# Print the length of the DataFrame df
print(len(df))

# Print the head of the DataFrame df
print(df.head())
查询table_name
# Save the table names to a list: table_names
table_name = engine.table_name()

<script.py> output:
    ['Album', 'Artist', 'Customer', 'Employee', 'Genre', 'Invoice', 'InvoiceLine', 'MediaType', 'Playlist', 'PlaylistTrack', 'Track']
使用JOIN
rs = con.execute("SELECT Title,Name FROM Album INNER JOIN Artist on Album.ArtistID == Artist.ArtistID")
使用Pandas + sqlalchemy
# Import packages
from sqlalchemy import create_engine
import pandas as pd

# Create engine: engine
engine = create_engine("sqlite:///Chinook.sqlite")

# Execute query and store records in DataFrame: df
df = pd.read_sql_query("SELECT * FROM Album", engine)
特点:不需要 open connection, 自动将结果DF化,包含标题,不需要手动关闭连接。
With Internet
get
get using pandas
# Import packages
import matplotlib.pyplot as plt
import pandas as pd

# Assign url of file: url
url = 'https://s3.amazonaws.com/assets.datacamp.com/production/course_1606/datasets/winequality-red.csv'

# Read file into a DataFrame: df
df = pd.read_csv(url,sep = ";")

# Print the head of the DataFrame
print(df.head())
get using urlretrieve
功能: Save file locally, 相当于下载目标URL内容
可以将get 得到的内容保存到本地
# Import package
from urllib.request import urlretrieve

# Import pandas
import pandas as pd

# Assign url of file: url
url= 'https://s3.amazonaws.com/assets.datacamp.com/production/course_1606/datasets/winequality-red.csv'

# Save file locally
urlretrieve(url,"winequality-red.csv")

# Read file into a DataFrame and print its head
df = pd.read_csv('winequality-red.csv', sep=';')
print(df.head())
get using urlopen,Request
# Import packages
from urllib.request import urlopen,Request

# Specify the url
url = "https://campus.datacamp.com/courses/1606/4135?ex=2"

# This packages the request: request
# 打包
request = Request(url)

# Sends the request and catches the response: response
# 发送后接收
response = urlopen(request)

# Print the datatype of response
# 打印对象
print(type(response))
# 结果是   <class 'http.client.HTTPResponse'>

# Be polite and close the response!
response.close()
打印内容
# Extract the response: html
html = response.read()

# Print the html
print(html)
get using requests
# Import package
import requests

# Specify the url: url
url = "http://www.datacamp.com/teach/documentation"

# Packages the request, send the request and catch the response: r
# 特别注意这里的 requests.get 不是 get, 而是request
r = requests.get(url)

# Extract the response: text
text = r.text

# Print the html
print(text)
BeautifulSoup
Function
- Parse and extract structured data from HTML
- Make tag soup beautiful and extract information
Html
Mix of unstructured and structured data
- Structured data
- Has pre-dedined data model, or
- Organized in a defined manner
- Unstructured data: neither of these properties
Usage
# Import packages
import requests
from bs4 import BeautifulSoup #注意大小写

# Specify url: url
url = "https://www.python.org/~guido/"

# Package the request, send the request and catch the response: r
r = requests.get(url) #容易写成request

# Extracts the response as html: html_doc
html_doc = r.text

# Create a BeautifulSoup object from the HTML: soup
soup = BeautifulSoup(html_doc) # 注意大小写

# Get the title of Guido's webpage: guido_title
guido_title = soup.title

# Get Guido's text: guido_text
guido_text = soup.text

# Prettify the BeautifulSoup object: pretty_soup
pretty_soup = soup.prettify()

# Print the response
print(pretty_soup)
Findurl
# Find all 'a' tags (which define hyperlinks): a_tags
a_tags = soup.find_all('a')

# Print the URLs to the shell
for link in a_tags:
    print(link.get('href'))
output:

pics.html
    pics.html
    http://www.washingtonpost.com/wp-srv/business/longterm/microsoft/stories/1998/raymond120398.htm
    images/df20000406.jpg
    http://neopythonic.blogspot.com/2016/04/kings-day-speech.html
    http://www.python.org
    Resume.html
    Publications.html
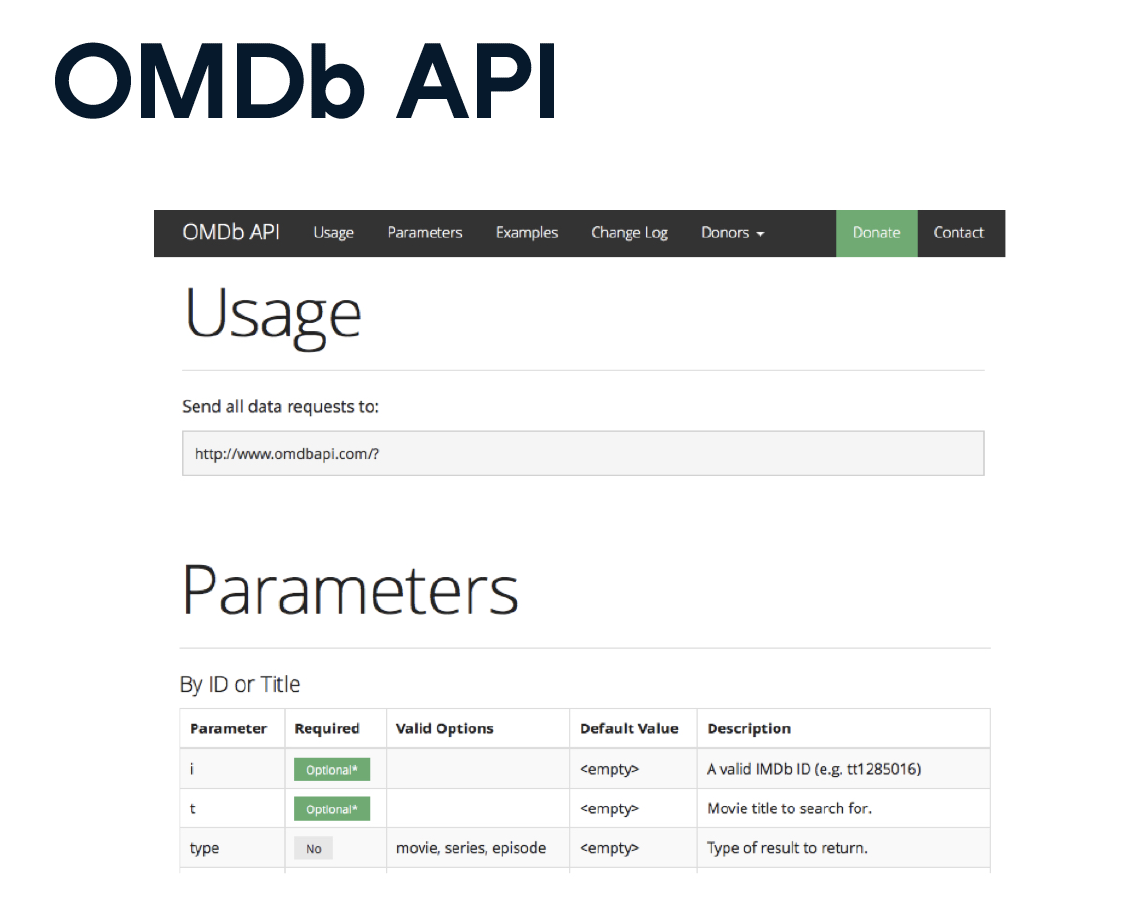
APIs
API 即获取信息的通用接口。
JSON
# Load JSON: json_data
with open("a_movie.json") as json_file:
    json_data = json.load(json_file)

# Print each key-value pair in json_data
for k in json_data.keys():
    print(k + ': ', json_data[k])
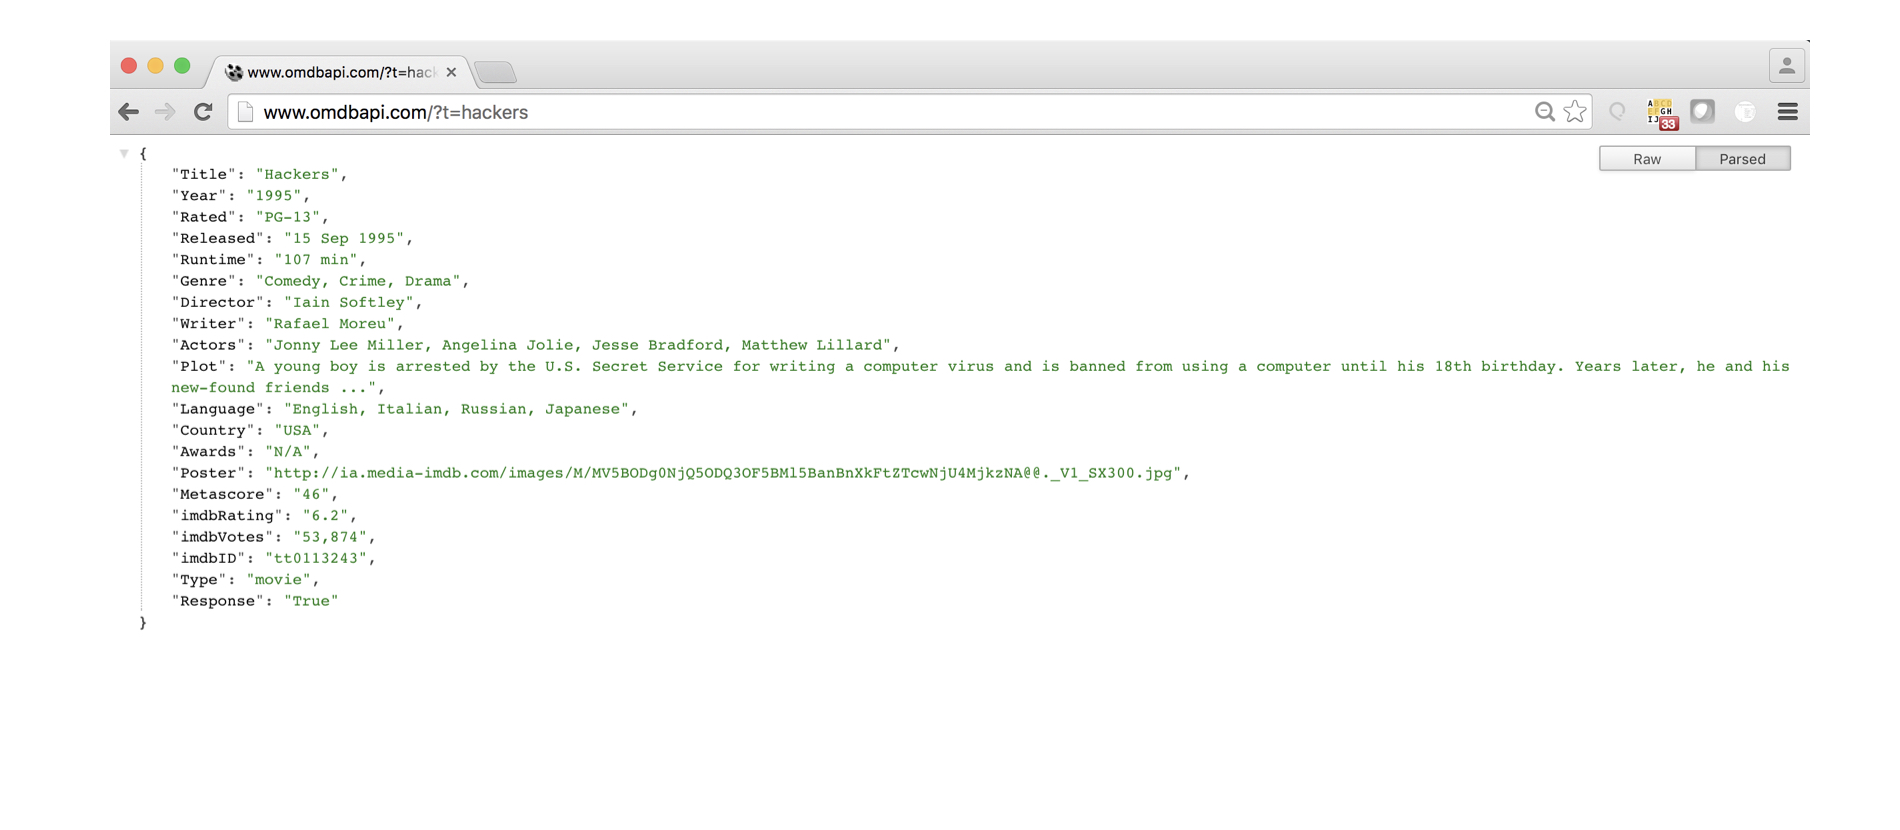
通过URL
'http://www.omdbapi.com/?t=hackers'
- http - making an HTTP request
- www.omdbapi.com - querying the OMDB API
- ?t=hackers
- Query string
- Return data for a movie with title (t) ‘Hackers’
# Import requests package
import requests

# Assign URL to variable: url
url = 'http://www.omdbapi.com/?apikey=72bc447a&t=the+social+network'

# Package the request, send the request and catch the response: r
r = requests.get(url)

# Print the text of the response
print(r.text)

<script.py> output:
    {"Title":"The Social Network","Year":"2010","Rated":"PG-13","Released":"01 Oct 2010","Runtime":"120 min","Genre":"Biography, Drama"......}
使用requests 以JSON格式解码
# Package the request, send the request and catch the response: r
r = requests.get(url)

# Decode the JSON data into a dictionary: json_data
json_data = r.json()

# Print each key-value pair in json_data
for k in json_data.keys():
    print(k + ': ', json_data[k])
Example: Twetter API
The package tweepy is great at handling all the Twitter API OAuth Authentication details for you. All you need to do is pass it your authentication credentials. In this interactive exercise, we have created some mock authentication credentials.
- Import the package
tweepy. - Pass the parameters
consumer_keyandconsumer_secretto the functiontweepy.OAuthHandler(). - Complete the passing of OAuth credentials to the OAuth handler
authby applying to it the methodset_access_token(), along with argumentsaccess_tokenandaccess_token_secret.
# Import package
import tweepy

# Store OAuth authentication credentials in relevant variables
access_token = "1092294848-aHN7DcRP9B4VMTQIhwqOYiB14YkW92fFO8k8EPy"
access_token_secret = "X4dHmhPfaksHcQ7SCbmZa2oYBBVSD2g8uIHXsp5CTaksx"
consumer_key = "nZ6EA0FxZ293SxGNg8g8aP0HM"
consumer_secret = "fJGEodwe3KiKUnsYJC3VRndj7jevVvXbK2D5EiJ2nehafRgA6i"

# Pass OAuth details to tweepy's OAuth handler
auth = tweepy.OAuthHandler(consumer_key, consumer_secret)
set_access_token = auth.set_access_token(access_token,access_token_secret)
Now that you have set up your authentication credentials, it is time to stream some tweets! We have already defined the tweet stream listener class, MyStreamListener, just as Hugo did in the introductory video. You can find the code for the tweet stream listener class here.
Your task is to create the Streamobject and to filter tweets according to particular keywords.
- Create your
Streamobject with authentication by passingtweepy.Stream()the authentication handlerauthand the Stream listenerl; - To filter Twitter streams, pass to the
trackargument instream.filter()a list containing the desired keywords'clinton','trump','sanders', and'cruz'.
# Initialize Stream listener
l = MyStreamListener()

# Create your Stream object with authentication
stream = tweepy.Stream(auth, l)

# Filter Twitter Streams to capture data by the keywords:
stream.filter(['clinton','trump','sanders','cruz'])
- Assign the filename
'tweets.txt'to the variabletweets_data_path. - Initialize
tweets_dataas an empty list to store the tweets in. - Within the
forloop initiated byfor line in tweets_file:, load each tweet into a variable,tweet, usingjson.loads(), then appendtweettotweets_datausing theappend()method. - Hit submit and check out the keys of the first tweet dictionary printed to the shell.
# Import package
import json

# String of path to file: tweets_data_path
tweets_data_path = 'tweets.txt'

# Initialize empty list to store tweets: tweets_data
tweets_data = []

# Open connection to file
tweets_file = open(tweets_data_path, "r")

# Read in tweets and store in list: tweets_data
for line in tweets_file:
    tweet = json.loads(line)
    tweets_data.append(tweet)

# Close connection to file
tweets_file.close()

# Print the keys of the first tweet dict
print(tweets_data[0].keys())
# Import package
import pandas as pd

# Build DataFrame of tweet texts and languages
df = pd.DataFrame(tweets_data, columns=['text','lang'])

# Initialize list to store tweet counts
clinton, trump, sanders, cruz = (0, 0, 0, 0)

# Iterate through df, counting the number of tweets in which
# each candidate is mentioned
for index, row in df.iterrows():
    clinton += word_in_text('clinton', row['text'])
    trump += word_in_text('trump', row['text'])
    sanders += word_in_text('sanders', row['text'])
    cruz += word_in_text('cruz', row['text'])

# Import packages
import matplotlib.pyplot as plt
import seaborn as sns

# Set seaborn style
sns.set(color_codes=True)

# Create a list of labels:cd
cd = ['clinton', 'trump', 'sanders', 'cruz']

# Plot the bar chart
ax = sns.barplot( y = [clinton, trump, sanders, cruz],x = cd)
ax.set(ylabel="count")
plt.show()
OS
listdir
In [1]: import os
In [2]: wd = os.getcwd()
In [3]: os.listdir(wd)

Out[3]: ['titanic.txt', 'battledeath.xlsx']