Application of Pandas
Application of Pandas
作者:韩佳明Hirsun。
笔者的建议是,不要用传统编程的思维去处理数据分析问题。
这份笔记不妨作为你的字典,随用随查。
可以把 Pandas 当做高性能的 Excel。对于上万的行数据,Pandas 可能是处理数据的最佳工具!
Pandas 包含了很多有用的功能,节省了工程师很多时间,而且运行起来比单纯用 For 遍历每一行数据要高效的多。
Read csv
movies = pd.read_csv('tmdb_movies.csv', index_col=['id'])
medals = pd.read_csv('medals_by_country_2016.csv', index_col=0)
data = pd.read_csv(file, nrows = 5, header = None) #读前5行,原文件中没有column name
data = pd.read_csv(file, sep="\t", comment="#", na_values='Nothing') # 设定分隔符号,注释,na时的填入值
转换成为 DataFrame
Dict to DataFrame
方法一
- key 是 column name
- value用列表表示,是 每一列的所有值,
>>> data = {'col_1': [3, 2, 1, 0],
            'col_2': ['a', 'b', 'c', 'd']}

>>> pd.DataFrame.from_dict(data)

   col_1 col_2
0      3     a
1      2     b
2      1     c
3      0     d
方法二
Specify orient='index' to create the DataFrame using dictionary keys as rows:
- 每一个条目代表一行
- key 是 index
>>> data = {'row_1': [3, 2, 1, 0], 'row_2': ['a', 'b', 'c', 'd']}
>>> pd.DataFrame.from_dict(data, orient='index', columns=['A', 'B', 'C', 'D'])

       A  B  C  D
row_1  3  2  1  0
row_2  a  b  c  d
List to DataFrame
df = pd.DataFrame(tweets_data, columns=['text','lang'])
df.iterrows()
df = pd.DataFrame(tweets_data, columns=['text','lang'])
# Initialize list to store tweet counts
clinton, trump, sanders, cruz = (0, 0, 0, 0)

# Iterate through df, counting the number of tweets in which
# each candidate is mentioned
for index, row in df.iterrows():
    clinton += word_in_text('clinton', row['text'])
    trump += word_in_text('trump', row['text'])
    sanders += word_in_text('sanders', row['text'])
    cruz += word_in_text('cruz', row['text'])
Print info
print(dog) #全部打印
dogs.head() # 默认参数5
dogs.info() # some information
dogs["height_cm"] > 50
0 True
1 False
2 False
3 False
4 True
5 False
6 True
Name: height_cm, dtype: bool
dogs.describe()
      height_cm weight_kg
count 7.000000 7.000000
mean 49.714286 27.428571
std 17.960274 22.292429
min 18.000000 2.000000
25% 44.500000 19.500000
50% 49.000000 23.000000
75% 57.500000 27.000000
max 77.000000 74.000000
dogs[["which_column1","which_column2"]]
# 打印指定列
区分下列用法
- df.shape: 描述行列数量
- df.info: 大略浏览数据表
- df.head(): 查看头部前几行
- df.describe(): 查看数据平均值,最大最小值。
- df.value_counts(): 统计每一种值有几个
Column & index
dogs.columns
dogs.index

dogs_ind = dogs.set_index("name")
dogs_ind3 = dogs.set_index(["breed", "color"])

# 重置索引成为从0开始计数,drop为True将删除旧的索引,False将旧索引当做一列放入表中。
dogs_ind.reset_index(drop=True)
dogs_ind.reset_index() # as below

dogs.columns = ["name",'id','phone'] # reset column name
column 是唯一的,而 index 不是唯一的。
可以使用 df.index.is_unique 判断 index是否唯一。
Sort
sort_values()
dogs = dogs.sort_values(["which_column1","which_c2"],ascending = True)
dogs = dogs.sort_values(["which_column1","which_c2"],ascending = [True,False])
sort_index()
按索引由小到大排序
df = df.sort_index()
过滤数据
[] 符号
df['column_name']
dogs["height_cm"] > 50
0 True
1 False
2 False
3 False
4 True
5 False
6 True
Name: height_cm, dtype: bool
dogs[dogs["height_cm"] > 50]
& | # and or
is_black_or_brown = dogs["color"].isin(["Black", "Brown"])
过滤 row
需要注意的是,标题不占行。从0开始计数。
4 df[0:] #第0行及之后的行,相当于df的全部数据,注意冒号是必须的
5 df[:2] #第2行之前的数据(不含第2行)
6 df[1:2] #第1行
7 df[1:3] #第1行到第2行(不含第3行)
8 df[‐1:] #最后一行
9 df[‐3:‐1] #倒数第3行到倒数第1行(不包含最后1行即倒数第1行,这里有点烦躁,因为从前数时从第0行开始,从后数就是‐1行开始,毕竟没有‐0
Filter with function
df.filter( True / False)
# Selecting the laureates that have received 2 or more prizes.
nobel.groupby('full_name').filter(lambda group: len(group) >= 2)
drop
# Drop values using filtering
movies = movies[movies['avg_rating'] <= 5]
# Drop values using .drop()
movies.drop(movies[movies['avg_rating'] > 5].index, inplace = True)
凡是会对原数组作出修改并返回一个新数组的,往往都有一个 inplace可选参数。如果手动设定为True(默认为False),那么原数组直接就被替换。也就是说,采用inplace=True之后,原数组名(如2和3情况所示)对应的内存值直接改变;
而采用inplace=False之后,原数组名对应的内存值并不改变,需要将新的结果赋给一个新的数组或者覆盖原数组的内存位置。
Loc
df.loc[index,column]
选取指定行,列的数据.
包含边界值
2 df.loc[0,'name'] # 'Snow'
3 df.loc[0:2, ['name','age'] ] #选取第0行到第2行,name列和age列的数据, 注意这里的行选取是包含下标的。
4 df.loc[[2,3],['name','age'] ] #选取指定的第2行和第3行,name和age列的数据

5 df.loc[df['gender']=='M','name'] #选取gender列是M,name列的数据
6 df.loc[df['gender']=='M',['name','age']] #选取gender列是M,name和age列的数据
df.loc["index_name"]
记住有且只有而且是第一个参数
dogs_ind3.loc[["Labrador", "Chihuahua"]]

dogs_ind3.loc[[("Labrador", "Brown"), ("Chihuahua", "Tan")]]

iloc[row_index, column_index]
不包含边界
1 df.iloc[0,0] #第0行第0列的数据,'Snow'
2 df.iloc[1,2] #第1行第2列的数据,32
3 df.iloc[[1,3],0:2] #第1行和第3行,从第0列到第2列(不包含第2列)的数据
4 df.iloc[1:3,[1,2] #第1行到第3行(不包含第3行),第1列和第2列的数据
前几大后几大
找出某列数据前2大
# Picking out the first woman to win a Nobel Prize
# ... YOUR CODE FOR TASK 5 ...
nobel[nobel['sex'] == 'Female'].nsmallest(2, 'year')
| year | category | prize | motivation | prize_share | laureate_id | laureate_type | full_name | birth_date | birth_city | ... | sex | organization_name | organization_city | organization_country | death_date | death_city | death_country | usa_born_winner | decade | female_winner | |
|---|---|---|---|---|---|---|---|---|---|---|---|---|---|---|---|---|---|---|---|---|---|
| 19 | 1903 | Physics | The Nobel Prize in Physics 1903 | "in recognition of the extraordinary services ... | 1/4 | 6 | Individual | Marie Curie, née Sklodowska | 1867-11-07 | Warsaw | ... | Female | NaN | NaN | NaN | 1934-07-04 | Sallanches | France | False | 1900 | True |
| 29 | 1905 | Peace | The Nobel Peace Prize 1905 | NaN | 1/1 | 468 | Individual | Baroness Bertha Sophie Felicita von Suttner, n... | 1843-06-09 | Prague | ... | Female | NaN | NaN | NaN | 1914-06-21 | Vienna | Austria | False | 1900 | True |
display(nobel.nlargest(1, 'age'))
.query()
和sql很相似
# .query('SOME SELECTION STATEMENT')
stocks.query('nike >= 90')
stocks.query('nike > 90 and disney < 140')
stocks.query('nike > 96 or disney < 98')
stocks_long.query('stock=="disney" or (stock=="nike" and close < 90)')
New Column
通过 []
dogs["height_m"] = dogs["height_cm"] / 100
# 新建的列是存在列的值的求函数结果
import pandas as pd
brics = pd.read_csv("brics.csv", index_col = 0)
brics["name_length"] = brics["country"].apply(len)
print(brics)

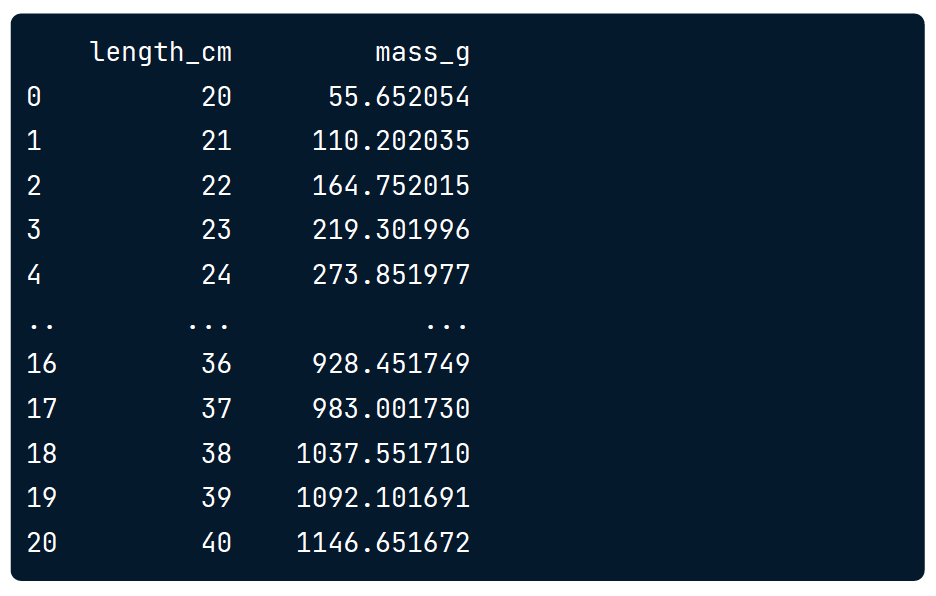
通过 assign
# mass_g 是新的column的名称, data2是单列的df
data = data.assign( mass_g=data2 )
Built-in function
np.mean() #full name ,仅一部分是
- .median() , .mode()
- .min() , .max()
- .var() , .std()
- .sum()
- .quantile() 分位数
- .cumsum() 积和
- .cummin()
- .cumprod()
- .corr() 相关系数(特征工程需要的!!!)
ride_sharing['ride_dt'].max()
ride_sharing['ride_dt'].mean()
ride_sharing['ride_dt'].min()
dogs["height_cm"].mean()
dogs_height_by_breed_vs_color.mean(axis="index") #留下column name,对每行求平均值
dogs_height_by_breed_vs_color.mean(axis="columns")#留下index name,对每一列求平均值
agg
def pct30(column):
	return column.quantile(0.3)

dogs["weight_kg"].agg(pct30)
dogs[["weight_kg", "height_cm"]].agg("pct30")
weight_kg 22.6
height_cm 45.4
dtype: float64
dogs["weight_kg"].cumsum()
0 24
1 48
2 72
3 89
4 118
5 120
6 194
Name: weight_kg, dtype: int64
Proportions
unique_dogs["breed"].value_counts(normalize=True)
Labrador 			0.250
Chow Chow 		0.250
Schnauzer 		0.125
St. Bernard 	0.125
Poodle 				0.125
Chihuahua 		0.125
Name: breed, dtype: float64
Groupby
dogs.groupby("color")["weight_kg"].mean()
dogs.groupby(["color", "breed"])["weight_kg"].mean()
dogs.groupby(["color", "breed"])[["weight_kg", "height_cm"]].mean()
color
Black    26.5
Brown    24.0
Gray     17.0
Tan      2.0
White    74.0
Name: weight_kg, dtype: float64

color	    breed
Black     Chow Chow 25
          Labrador  29
					Poodle    24
Brown     Chow Chow 24
					Labrador 24
Gray      Schnauzer 17
Tan 			Chihuahua 2
White     St. Bernard 74
Name: weight_kg, dtype: int64

											weight_kg  height_cm
color       breed
Black 			Labrador 	29 				59
						Poodle 		24 				43
Brown			  Chow Chow 24 				46
						Labrador 	24 				56
Gray 				Schnauzer 17 				49
Tan 				Chihuahua 2 				18
White 			St. Bernard 74 			77
.size()
求group之后的每一个群组的行数
In [14]:
df.groupby("Degree_Type").size()

Out[14]:
Degree_Type
Associates     1477
Bachelors       727
Certificate    2152
Graduate       1993
Non-degree      353
dtype: int64
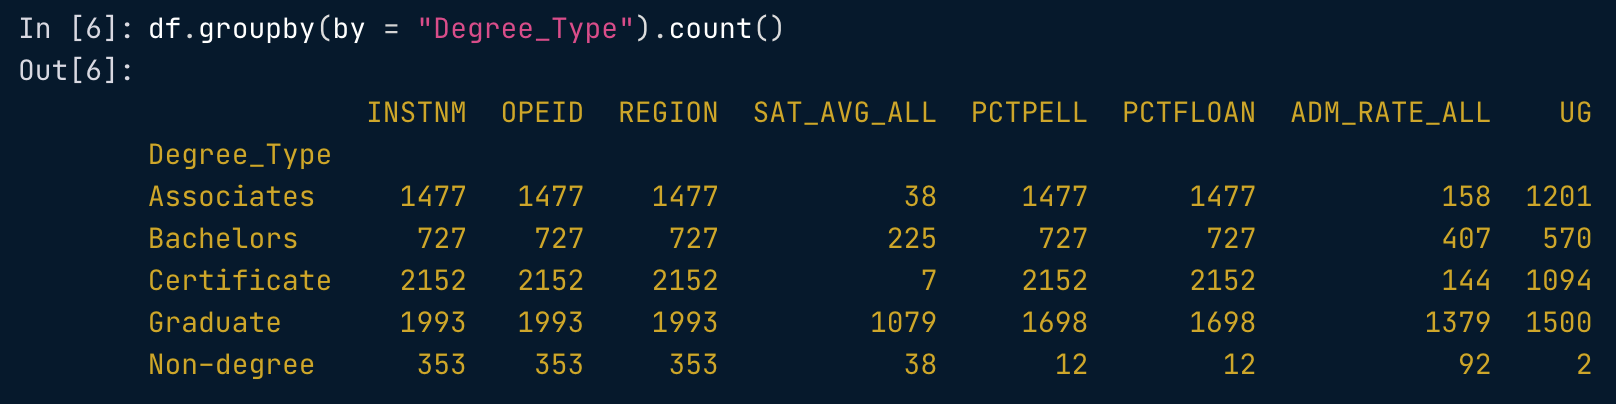
区分.count()
With agg
dogs.groupby("color")["weight_kg"].agg([min, max, sum])
				min max sum
color
Black 	24 29 53
Brown 	24 24 48
Gray 		17 17 17
Tan 		2  2  2
White 	74 74 74
自定义方法
记得给函数名称加引号
grant_licenses_ward.groupby('ward').agg('funcName')
with dict
# Group by column names and produce statistical summaries
column_names = ['first_name','last_name','address']
summaries = {'height': 'max', 'weight': 'mean'}

height_weight = height_weight.groupby(by = column_names).agg(summaries).reset_index()
First ride per group
# First ride per group
rides.groupby('Member type').first()
Pivot
不展开
由一个x确定多个指定列的值,然后对这多个值求函数结果。
此时不指定列的名称
dogs.pivot_table(values="weight_kg",index="color" aggfunc = np.mean) # 默认是平均值

dogs.pivot_table(values="weight_kg", index="color", aggfunc=np.median)
dogs.pivot_table(values="weight_kg", index="color", aggfunc=[np.mean, np.median]) # output as below

展开
将某一列拿出来作为Column Name(x),再拿出一列当y,由一个y和一个x确定多个指定列的值,然后对这多个值求函数结果。
适用于 y的种类有限,x的种类有限。
不推荐
以下三个等价
dogs.groupby(["color", "breed"])["weight_kg"].mean()
dogs.pivot_table(values="weight_kg", index="color", aggfunc=np.mean)
dogs.pivot_table(values="weight_kg", index="color", columns="breed") #output as below

dogs.pivot_table(values="weight_kg", index="color", columns="breed", fill_value=0)
dogs.pivot_table(values="weight_kg", index="color", columns="breed",
fill_value=0, margins=True) # output as below

.melt()
Reshaping data with .melt()
相当于pivot 的反操作,从宽到长
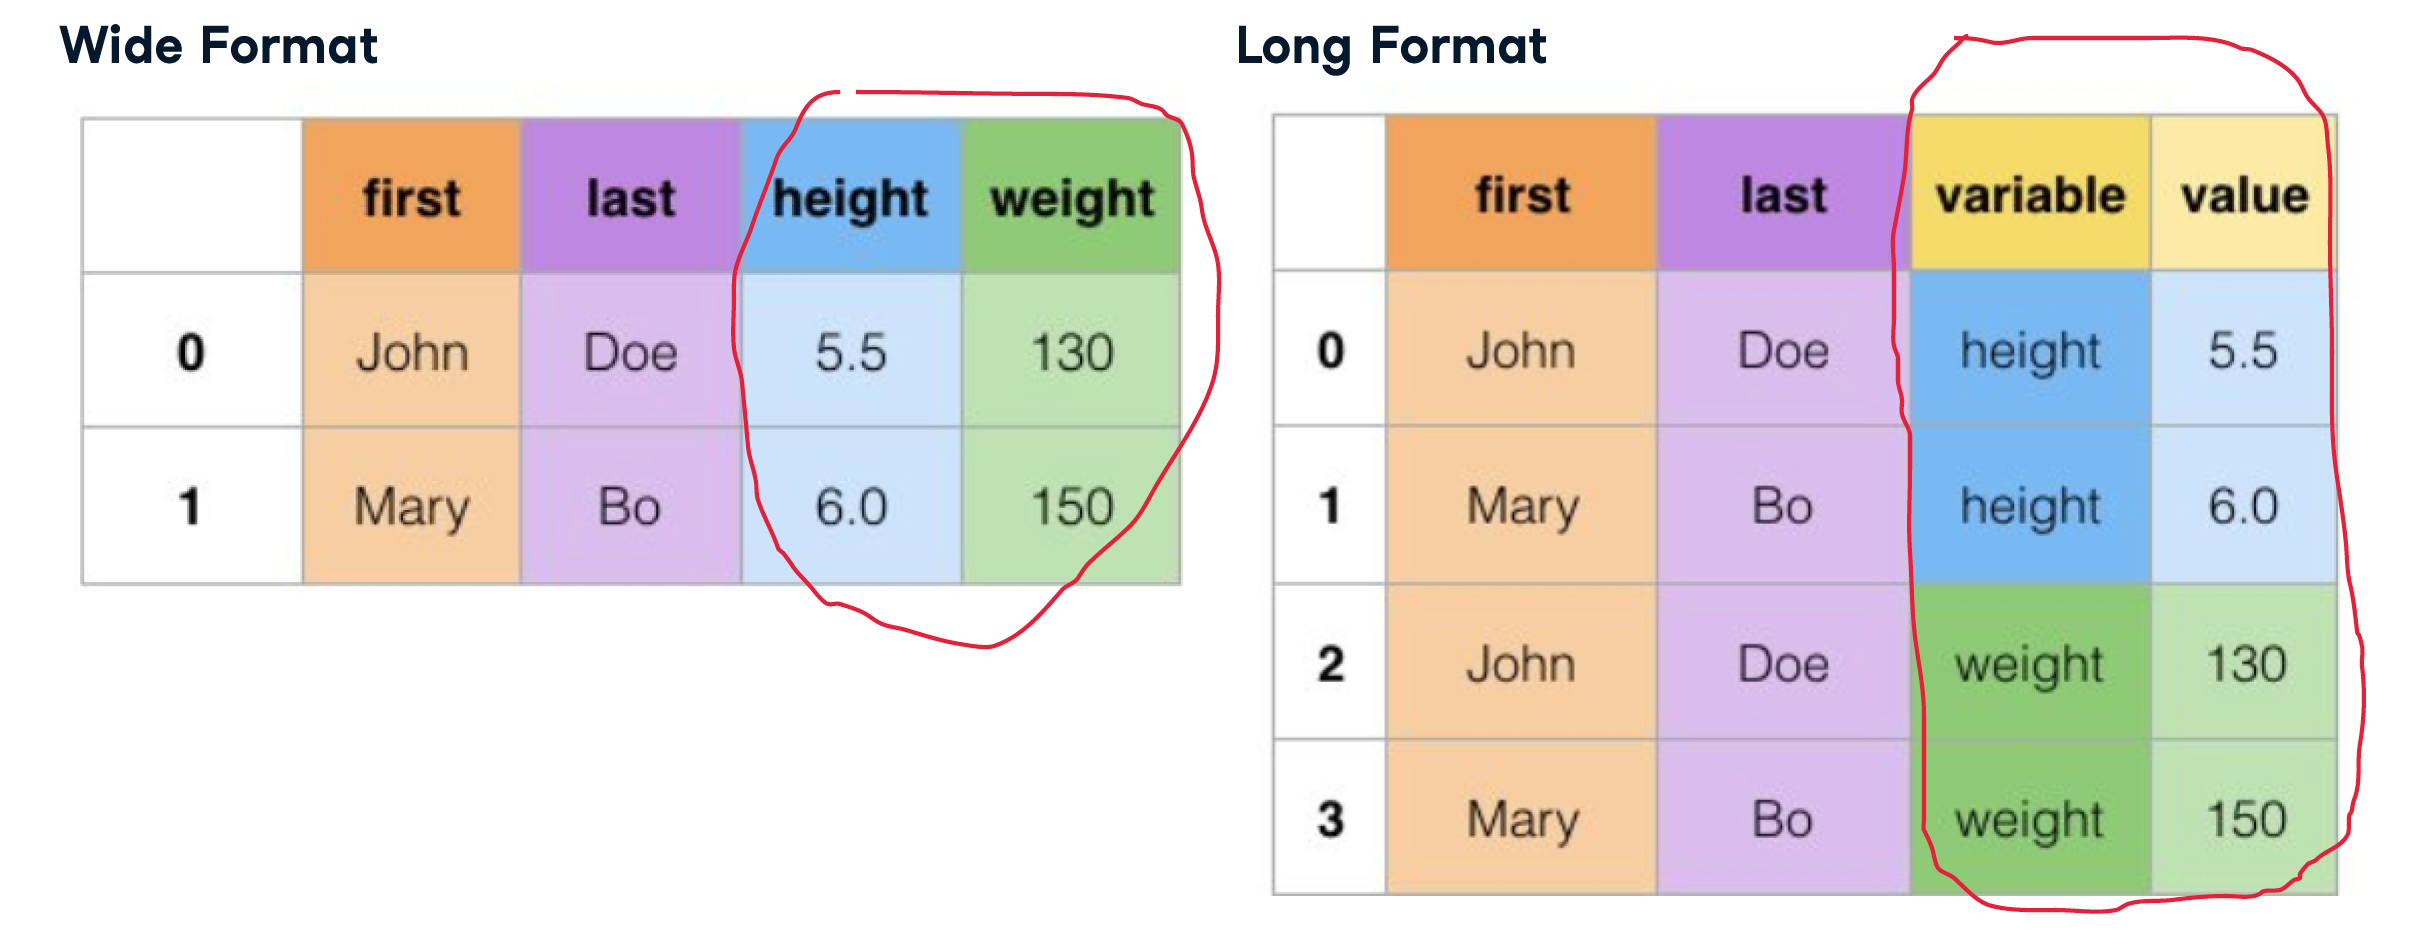

social_fin_tall = social_fin.melt(id_vars=['financial','company'],
		value_vars=['2018','2017'],
		var_name=['year'], value_name='dollars')

social_fin_tall = social_fin.melt(id_vars=['financial','company']) #全显示 as below

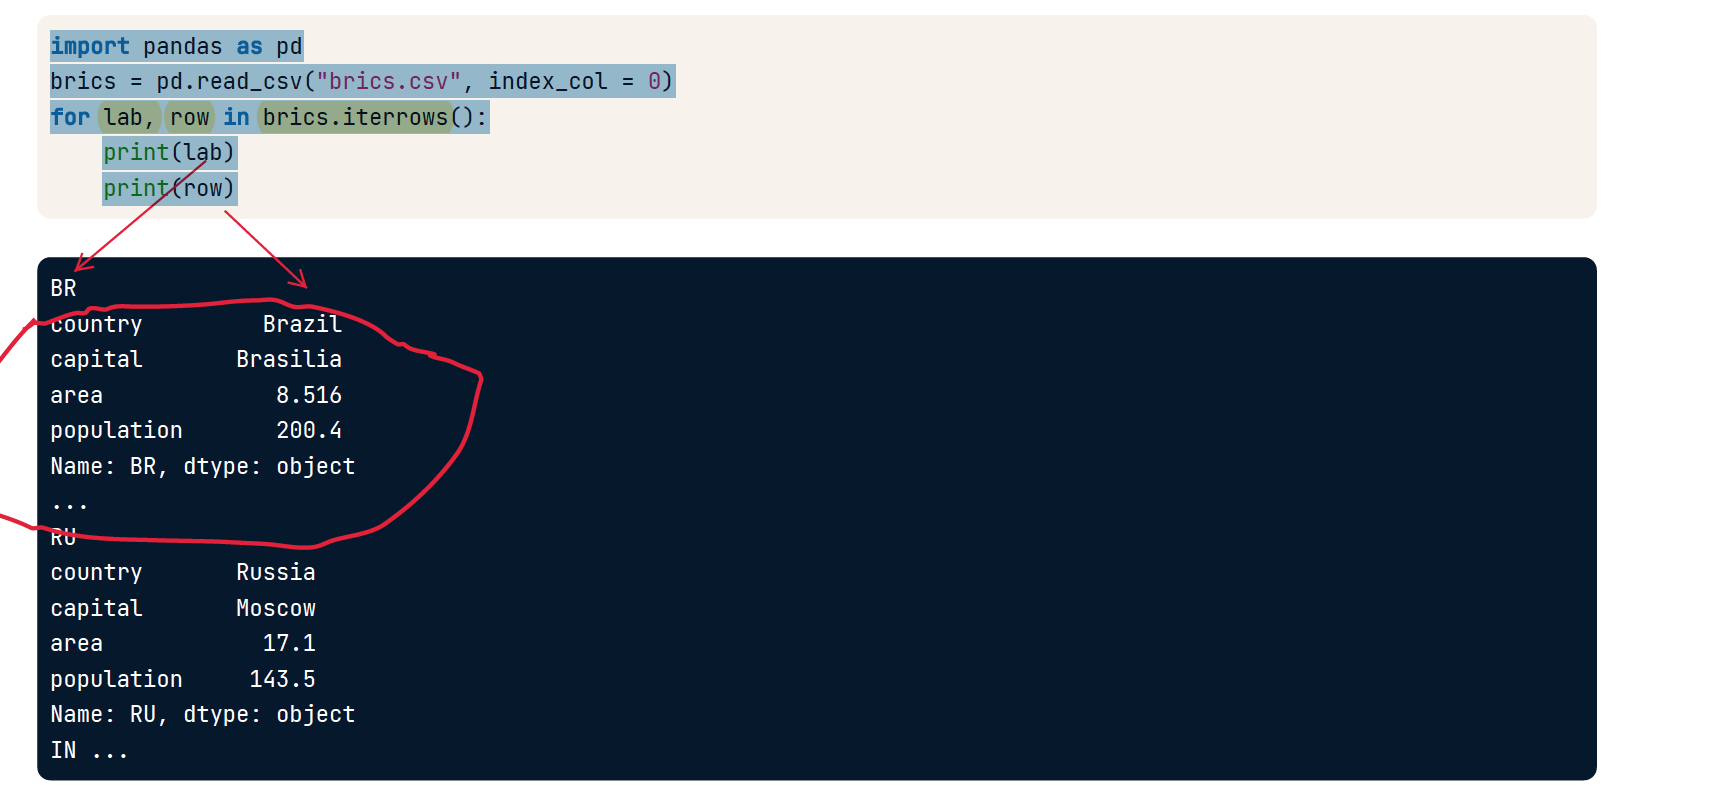
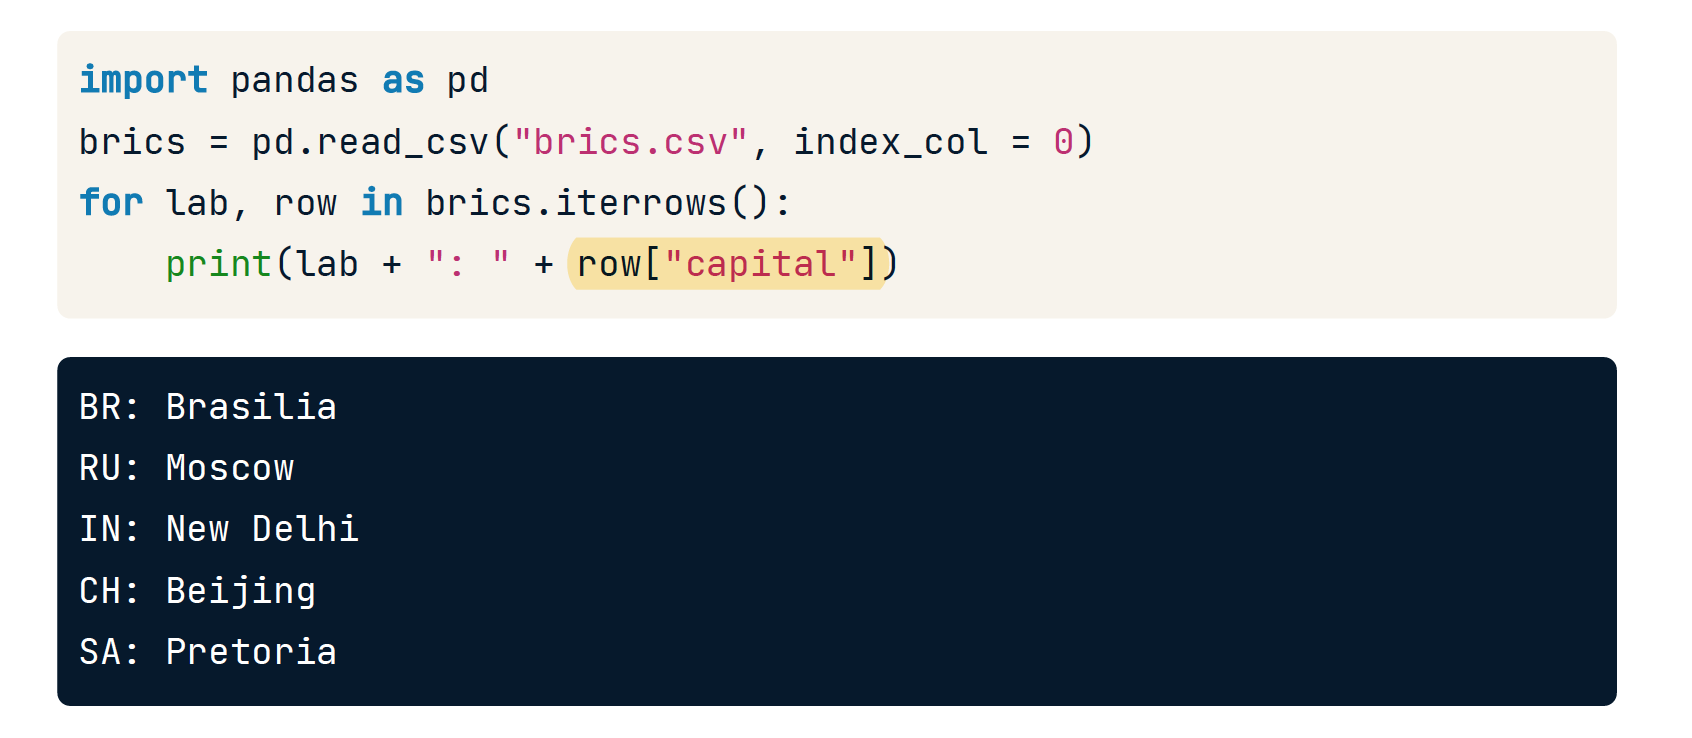
iterrows
import pandas as pd
brics = pd.read_csv("brics.csv", index_col = 0)

# 拆包成 lab(标签),row(行)
for lab, row in brics.iterrows():
  print(lab)
  print(row)
value_counts()
统计某一列中每一种值的个数。
# Display the number of (possibly shared) Nobel Prizes handed
# out between 1901 and 2016
print(len(nobel))

# Display the number of prizes won by male and female recipients.
print(nobel["sex"].value_counts())

# Display the number of prizes won by the top 10 nationalities.
nobel['birth_country'].value_counts().head(10)
911

Male      836
Female     49
Name: sex, dtype: int64

United States of America    259
United Kingdom               85
Germany                      61
France                       51
Sweden                       29
Japan                        24
Canada                       18
Netherlands                  18
Russia                       17
Italy                        17
Name: birth_country, dtype: int64
# 查看比例
ri.stop_outcome.value_counts(normalize=True)
Citation 0.890855
Warning 0.059351
Arrest Driver 0.031605
No Action 0.007211
N/D 0.007014
Arrest Passenger 0.003964
批量操作
一般的地,每一列数据都是可以同时操作的。以下有几个例子
使用loc
# Set all values above 27 to 27
ride_sharing.loc[ride_sharing['tire_sizes'] > tire_sizes, 'tire_sizes'] = 27
使用replace
# Replace "Miss" with empty string ""
airlines['full_name'] = airlines['full_name'].str.replace("Miss","")
# this will replace "Boston Celtics" and "Texas" with "Omega Warrior"
df.replace(to_replace =["Boston Celtics", "Texas"], value ="Omega Warrior")
修改值
temp_fah = temperatures.loc[temperatures['Temperature'] > 40, 'Temperature']
temp_cels = (temp_fah - 32) * (5/9)
temperatures.loc[temperatures['Temperature'] > 40, 'Temperature'] = temp_cels
需要注意的是 loc会将裁切的表格复制到temp_fah而不是引用,因此需要第三步的重新赋值
Apply 整行/整列/全部
ref.: https://zhuanlan.zhihu.com/p/148743842
可以在数据表上进行批量操作的函数:
- 有些函数是元素级别的操作,比如求平方
np.square(),针对的是每个元素。有些函数则是对元素集合级别的操作,这里元素集合指的是以列为单位,或者行为单位,比如求和np.sum();这类函数默认是以列为单位操作,也可以指定参数axis=1来操作行。 - 至于函数的来源,可以python的内置函数,如
np.square(), 也可以是自定义的函数。自定义函数中,可以是用def关键字定义的函数,也可以是用lambda关键字自定义的函数。
内置函数
np.square

df = pd.DataFrame([[1,2],
                   [3,5]], columns=list('AB'))
df1 = df.apply(np.square)
print(df1)

		A   B
0   1   4
1   9  25
lambda函数模板
- lambda x: 语句操作或者返回值
- lambda x: 语句1 if 条件1 else 语句2
df = pd.DataFrame([[1,2],
                   [3,5]], columns=list('AB'))
c = df['A'].apply(lambda x: 111 if x<2 else 0)
print(c)
	     A
0    111
1      0
Name: A, dtype: int64
def 自定义函数
def function(x):
    return np.square(x) # 求平方

df = pd.DataFrame([[1,2],
                   [3,5]], columns=list('AB'))
df1 = df.apply(lambda x: function(x))
print(df1)

		A   B
0   1   4
1   9  25
操作单列所有元素
df = pd.DataFrame([[1,2],
                   [3,5]], columns=list('AB'))
c = df['A'].apply(np.square)
print(c)

		 A
0    1
1    9
Name: A, dtype: int64
操作单行所有元素
df = pd.DataFrame([[1,2],
                   [3,5]], columns=list('AB'))
c = df[2:3].apply(np.square)
print(c)

		 A    B
0    1    2
1    9		25
Name: A, dtype: int64
遍历列
适用于 整列求和 等操作。
df = pd.DataFrame([[1,2],
                                     [3,5]], columns=list('AB'))
df1 = df.apply(np.sum, axis=0)
print(df1)
A    4
B    7
遍历行
适用于 整行求和 等操作。
df = pd.DataFrame([[1,2],
                   [3,5]], columns=list('AB'))
df1 = df.apply(np.sum, axis=1)
print(df1)

0    3
1    8
dtype: int64
更改行名或列名
# 将 column name 为 two 的更改为 twotwo
df.rename(columns={'two':'twotwo'},inplace=True)
print(df)

# 将 row name 为 a 的更改为 aa, b 的改为 bb
df.rename(index={'a':'aa','b':'bb'},inplace=True)
print(df)

# 直接覆盖修改
df.columns=['onon','twtw','thth']
df.index=['a','b','c','d']
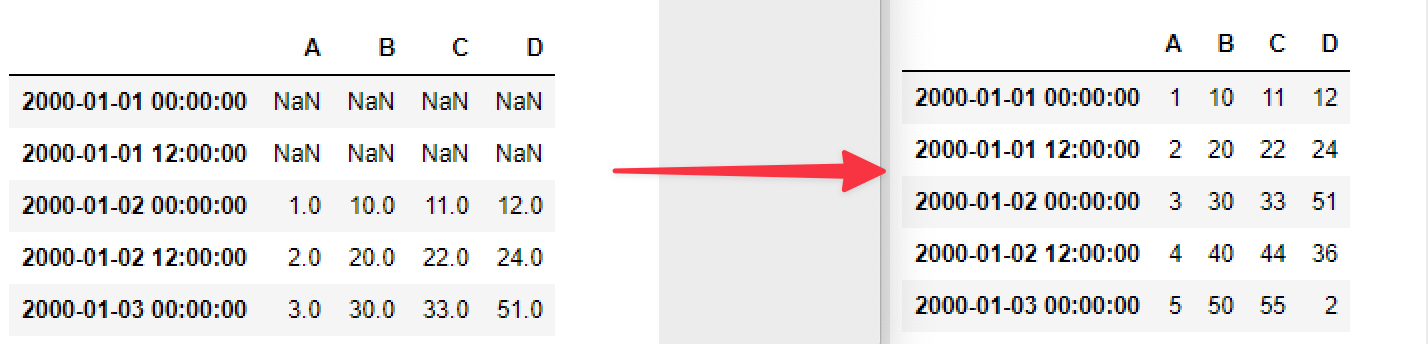
移动数据
shift函数是对数据进行移动的操作,注意仅移动数据。
df.shift(periods=2, axis = 0)
Write CSV
# saving the dataframe
df.to_csv('file1.csv')

# saving the dataframe disable header
df.to_csv('file2.csv', header=False, index=False)

# saving the dataframe with specified sep
df.to_csv('Users.csv', sep='\t')
提取值
上述的操作结果基本上都是 DataFrame, 而不是 一个具体的元素或者值。
jupyter 直接读取的结果
# The name of the youngest winner of the Nobel Prize as of 2016
name = nobel.nsmallest(1, 'age')["full_name"].reset_index()
name
Print dataframe
# The name of the youngest winner of the Nobel Prize as of 2016
name = nobel.nsmallest(1, 'age')["full_name"].reset_index()
print(name)
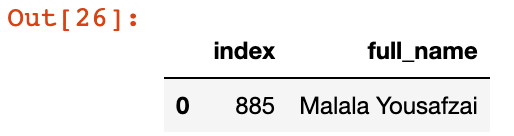
获取元素
其实上面两个是一样的,都得到的都是dataframe
想到得到元素,可以用 loc 或者 iloc读取单列值
# The name of the youngest winner of the Nobel Prize as of 2016
nobel.nsmallest(1, 'age')["full_name"].reset_index().iloc[0,1]
'Malala Yousafzai'
获取成为 numpy.ndarray
# 获得一维数组
y = churn_df["churn"].values

# 获得二维数组
X = churn_df[["total_day_charge", "total_eve_charge"]].values
其他注意事项
类型自动转换?
有的时候,当列表是一个元素的时候,可以不写成列表而直接写成一个字符串。尽管有的时候起作用,不过并不是所有情况都不报错。
investors = banking.dropna(subset=["inv_amount"]) //subset 只认列表
investors = banking.dropna(subset="inv_amount") // 这样写会报错
display() 还是 print()
打印pandas的数据时,这两种就可以互相替换。
display(len(nobel))
display(nobel["sex"].value_counts())
911
Male      836
Female     49
Name: sex, dtype: int64
通过. 访问数据
nobel[nobel.sex == 'Female'].nsmallest(1, 'year')
和
nobel[nobel['sex'] == 'Female'].nsmallest(2, 'year')
一样,更推荐后者。